CUBE Integration with Call Telemetry via XCC API
Call Telemetry connects to Cisco CUBE over the XCC API so you can enforce voice policies, fire alerts and webhooks in real time, and stream edge call-quality metrics into the same appliance.
This guide walks through adding a CUBE, configuring peer inspection, wiring the router remote-url, and verifying registration.
Feature Overview
Cisco Unified Border Element (CUBE) exposes the Extended Call Control (XCC) API (also documented by Cisco as CUCISAPI — we use XCC). An external application can inspect and act on calls as they traverse the CUBE, with built-in keepalive and fail-open behavior so calls continue if the application path is briefly unavailable.
For dashboards, MOS/jitter/packet-loss reporting, and peer health, see CUBE XCC Analytics and the product overview at CUBE & CMR Analytics.
Feature Requirements
- Call Telemetry Server Appliance 0.8.3 or later
- Call Telemetry Advanced License (CUBE XCC)
- Cisco CallManager integration recommended
- CURRI is not required — XCC can replace traditional CURRI for CUBE-edge policy
XCC Integration Process
Adding a Cisco CUBE XCC Integration
- Log in to your Call Telemetry dashboard
- Open Cubes → CUBE XCC Dashboard (CUBE Management)
- Click Add CUBE

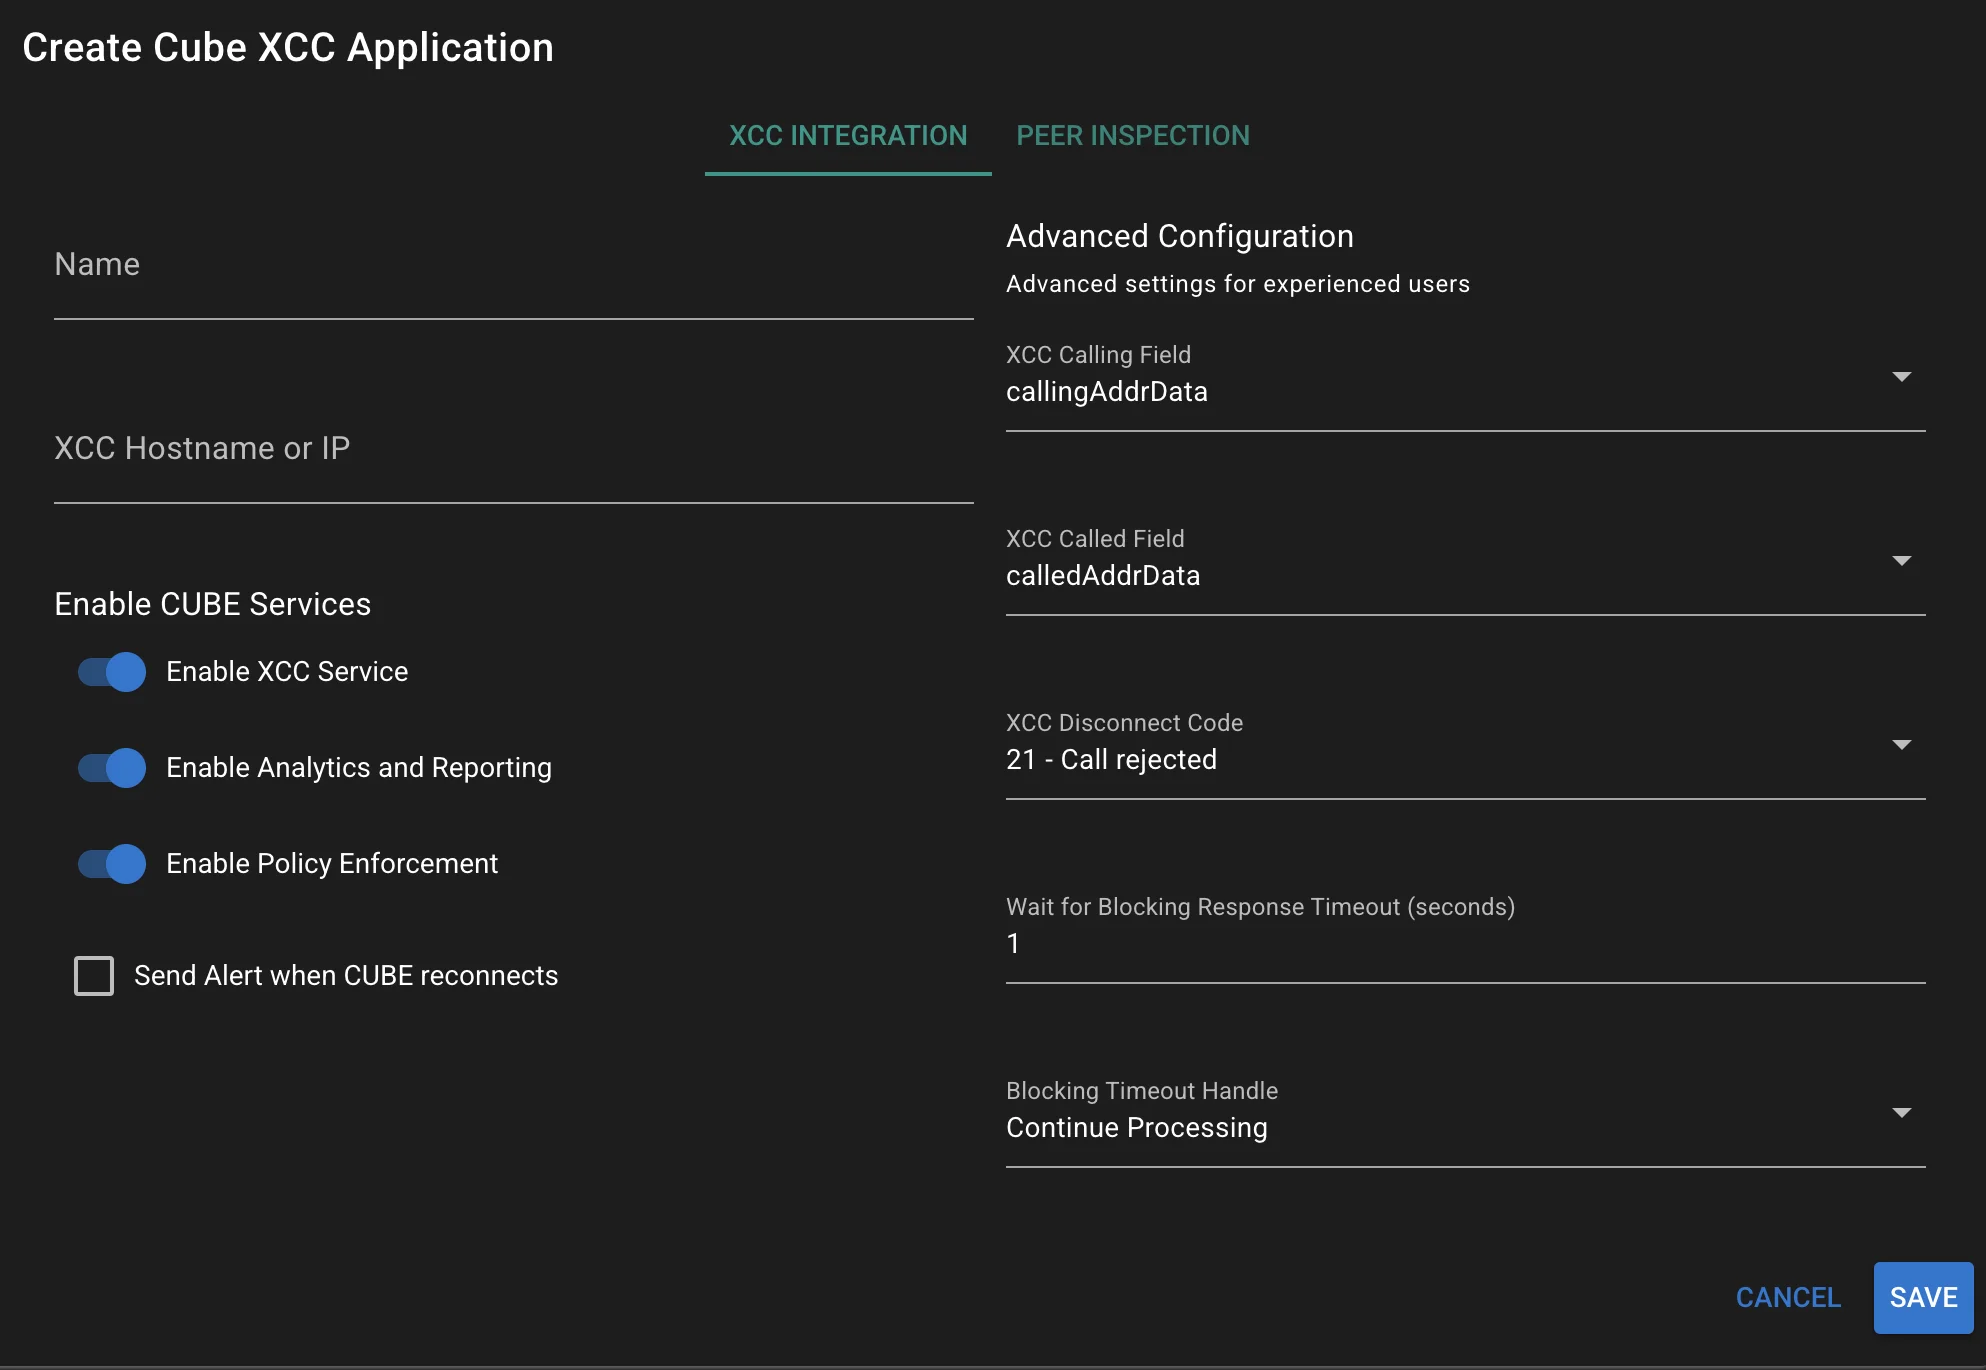
Configuration Fields
- CUBE Name: Unique, descriptive identifier (e.g.,
HQ-CUBE-01) - XCC Hostname or IP Address: Address Call Telemetry uses to reach the CUBE XCC provider
- Enable XCC Integration: Activates or deactivates the XCC session
- CUBE Analytics Enabled: Collects call-quality metrics (MOS, jitter, packet loss)
- Enable Policy Enforcement: Real-time policy checks; configure Peer Inspection below
- XCC Disconnect Code: SIP response used when blocking (suggested:
603 Decline) - Blocking Response Timeout: Seconds to wait for a blocking decision
- Blocking Timeout Action:
- Continue Processing: Allow the call to proceed
- Release Call: End the attempt
- XCC Keepalive Interval: Keepalive period in seconds (recommended: 10–30)
- Admin Alerts for Restarts: Notify when the XCC application restarts
- XCC Calling Number Field:
callingAddrData: Current calling numberorigCallingAddrData: Original calling number before translations
- XCC Called Number Field:
calledAddrData: Current called numberorigCalledAddrData: Original called number before translations
XCC Traffic Policy Filtering
XCC can inspect Call Telemetry policies in inbound and outbound directions. Add peer IP addresses (or CIDR ranges) to the XCC Peer Filter fields — similar to a Cisco VoIP trust list.
Direction is from the CUBE’s perspective. For example, Twilio SIP peers listed as Inbound are inspected on calls arriving from those peers. Listing your CallManager clusters as Outbound inspects calls leaving the CUBE toward those peers.
Inspect in one direction only; leave the other blank. The default policy action ignores and permits calls that do not match.
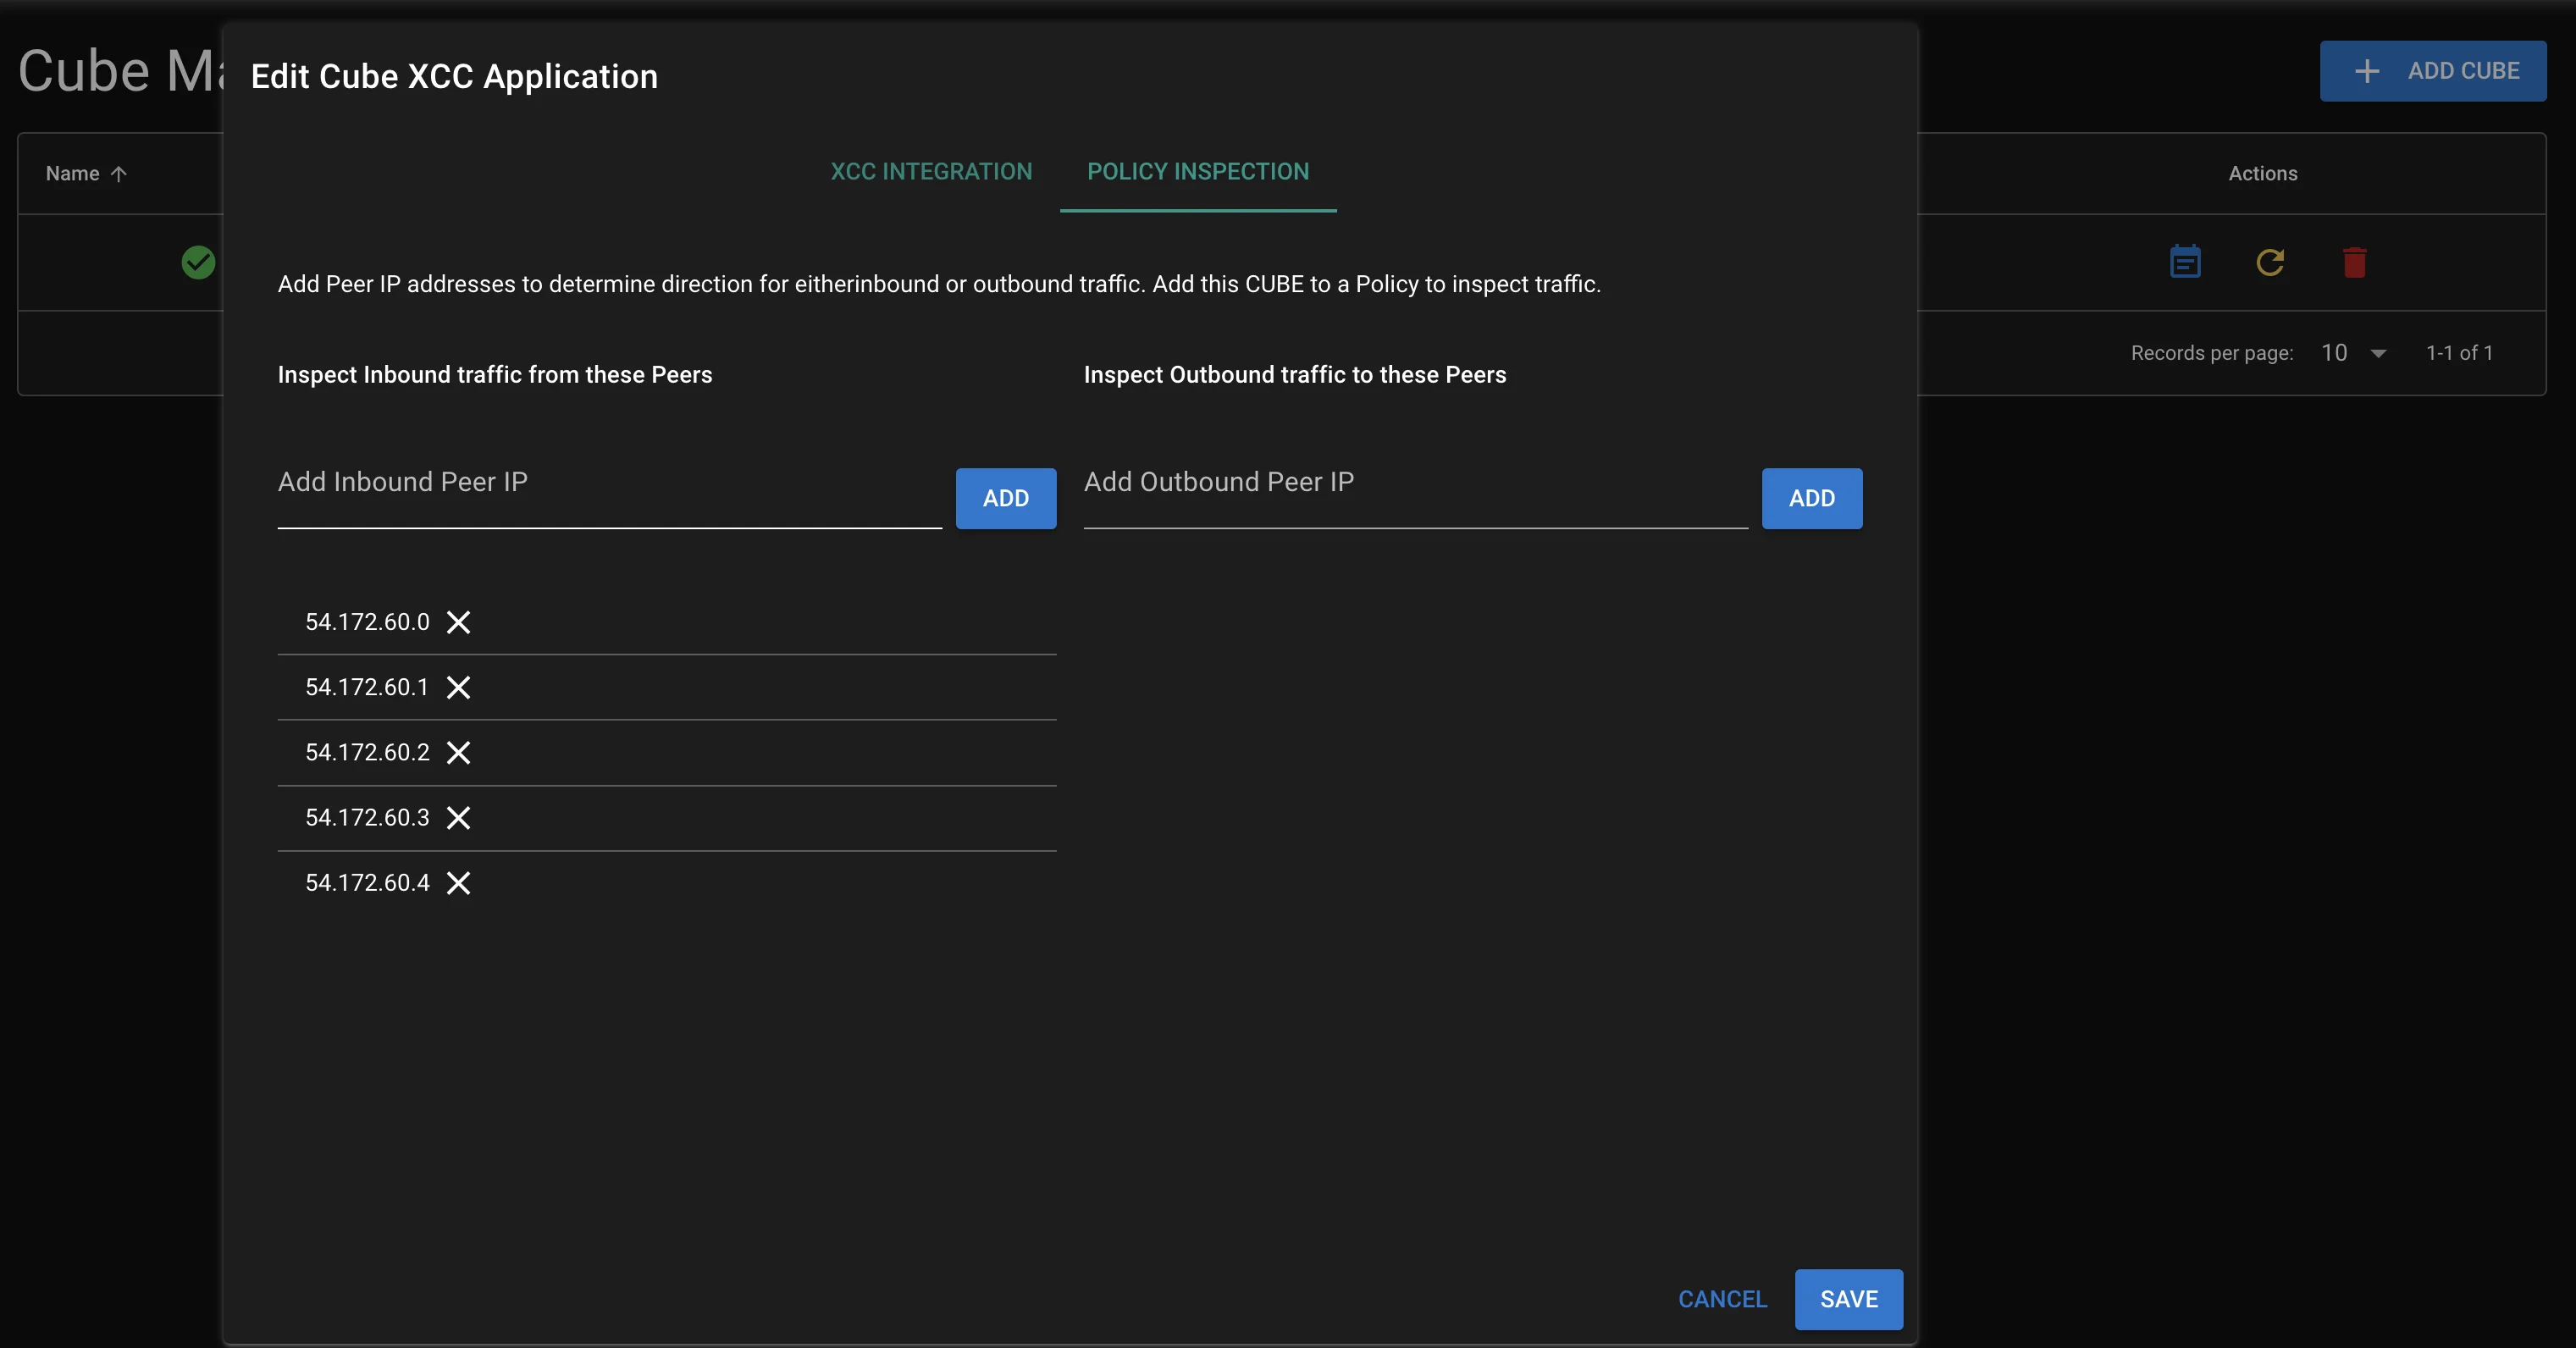
Review settings and click Submit to add the CUBE.
XCC Application URL
After saving, reopen the edit dialog. Call Telemetry shows the generated XCC Application URL. Configure that URL on the CUBE as the XCC remote-url.
The Application URL is currently generated as http://<appliance-hostname>:80/api/xcc/<cube-id>. Keep the explicit :80 — CUBE XCC matches remote-url as an exact string. Use the appliance’s reachable hostname, not a lab API bind port.
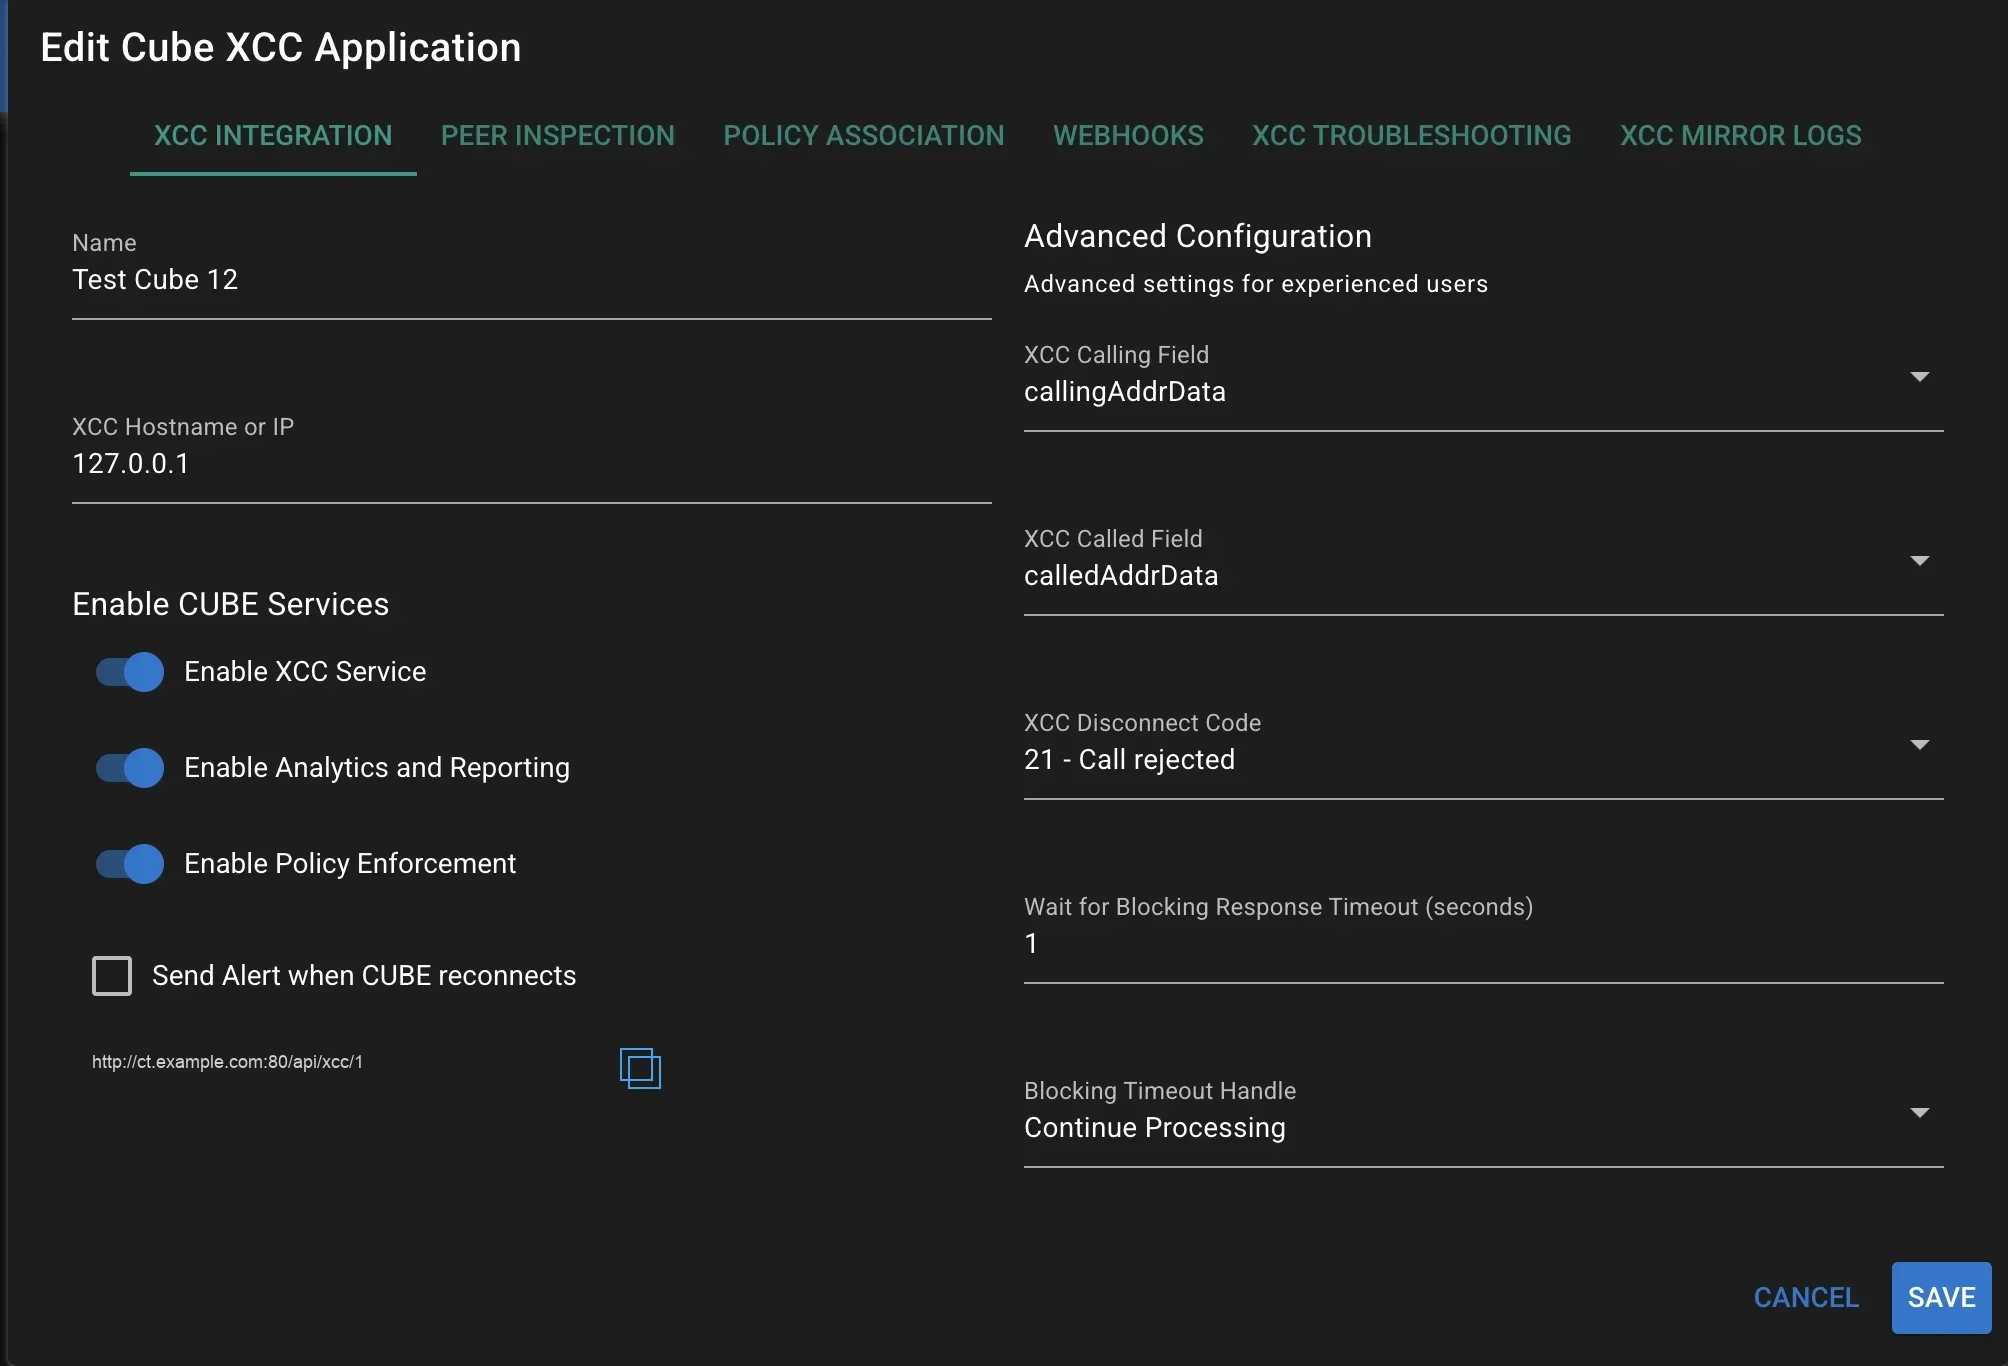
Configure the Cisco CUBE Router
ip http server
http client connection persistent
uc wsapi
 probing interval keepalive 10
 provider xcc
  remote-url (use the URL from the Edit Cube dialog)
  no shutdown
IOS Router Call Quality Configuration
On CUBEs you want to monitor, enable call quality statistics so P-RTP-Stat headers feed analytics (Cisco IOS Call Quality Monitoring Docs):
voice service voip
 callmonitor
  rtcp all-pass-through
  media statistics
  media bulk-stats
  call-quality
   max-dropout 100
   max-reorder 100
CUBEs then stream disconnect and quality metrics into the CUBE XCC Analytics dashboard.
- SIP-to-SIP calls only: Call quality statistics apply to SIP-to-SIP legs
- RTCP dependency: Round-trip delay needs RTCP from remote endpoints
- P-RTP-Stat: These settings enable P-RTP-Stat headers in BYE/200 OK messages
XCC Network and Firewall Configuration
The CUBE must reach Call Telemetry on the network.
Call Telemetry registers to the CUBE on TCP 8090 (plain HTTP by default). Call-processing requests from the CUBE to Call Telemetry use the Application URL — typically TCP 80.
Verify CUBE Registration
- Return to Cubes → CUBE XCC Dashboard
- Confirm the CUBE status shows Online (or Healthy) after the router registers
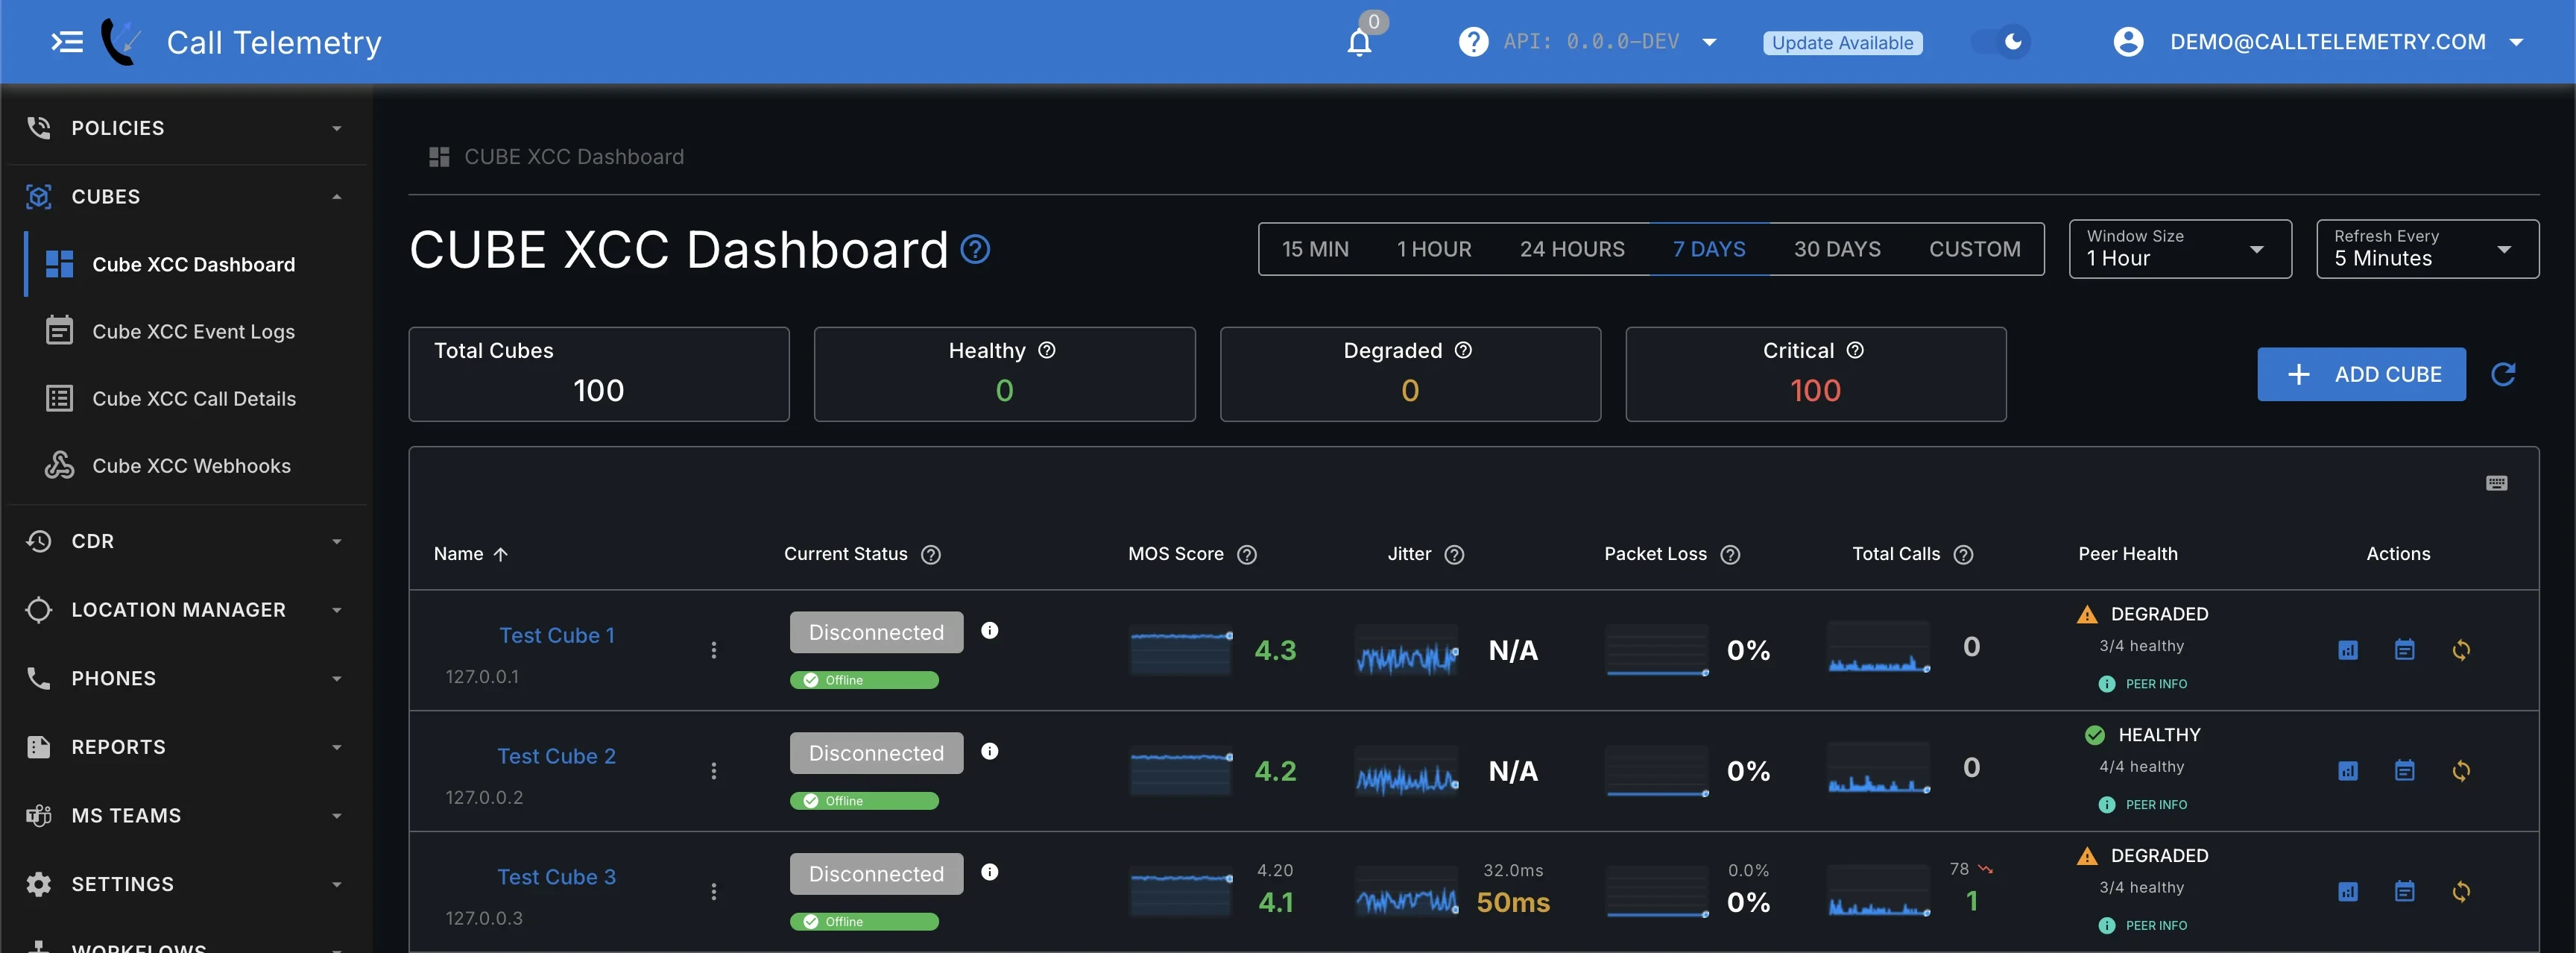
CUBE Management
Viewing CUBE Status
The dashboard lists each integrated CUBE with:
- CUBE Name
- XCC Hostname
- Registration / health status
- Quality sparklines (MOS, jitter, packet loss) when analytics is enabled
- Peer health summary
CUBE Actions
For each CUBE XCC service you can:
- View metrics / logs: Open event logs and quality views for troubleshooting
- Reconnect: Force a new registration attempt
- Delete: Remove the integration (confirmation required)
Event Logging
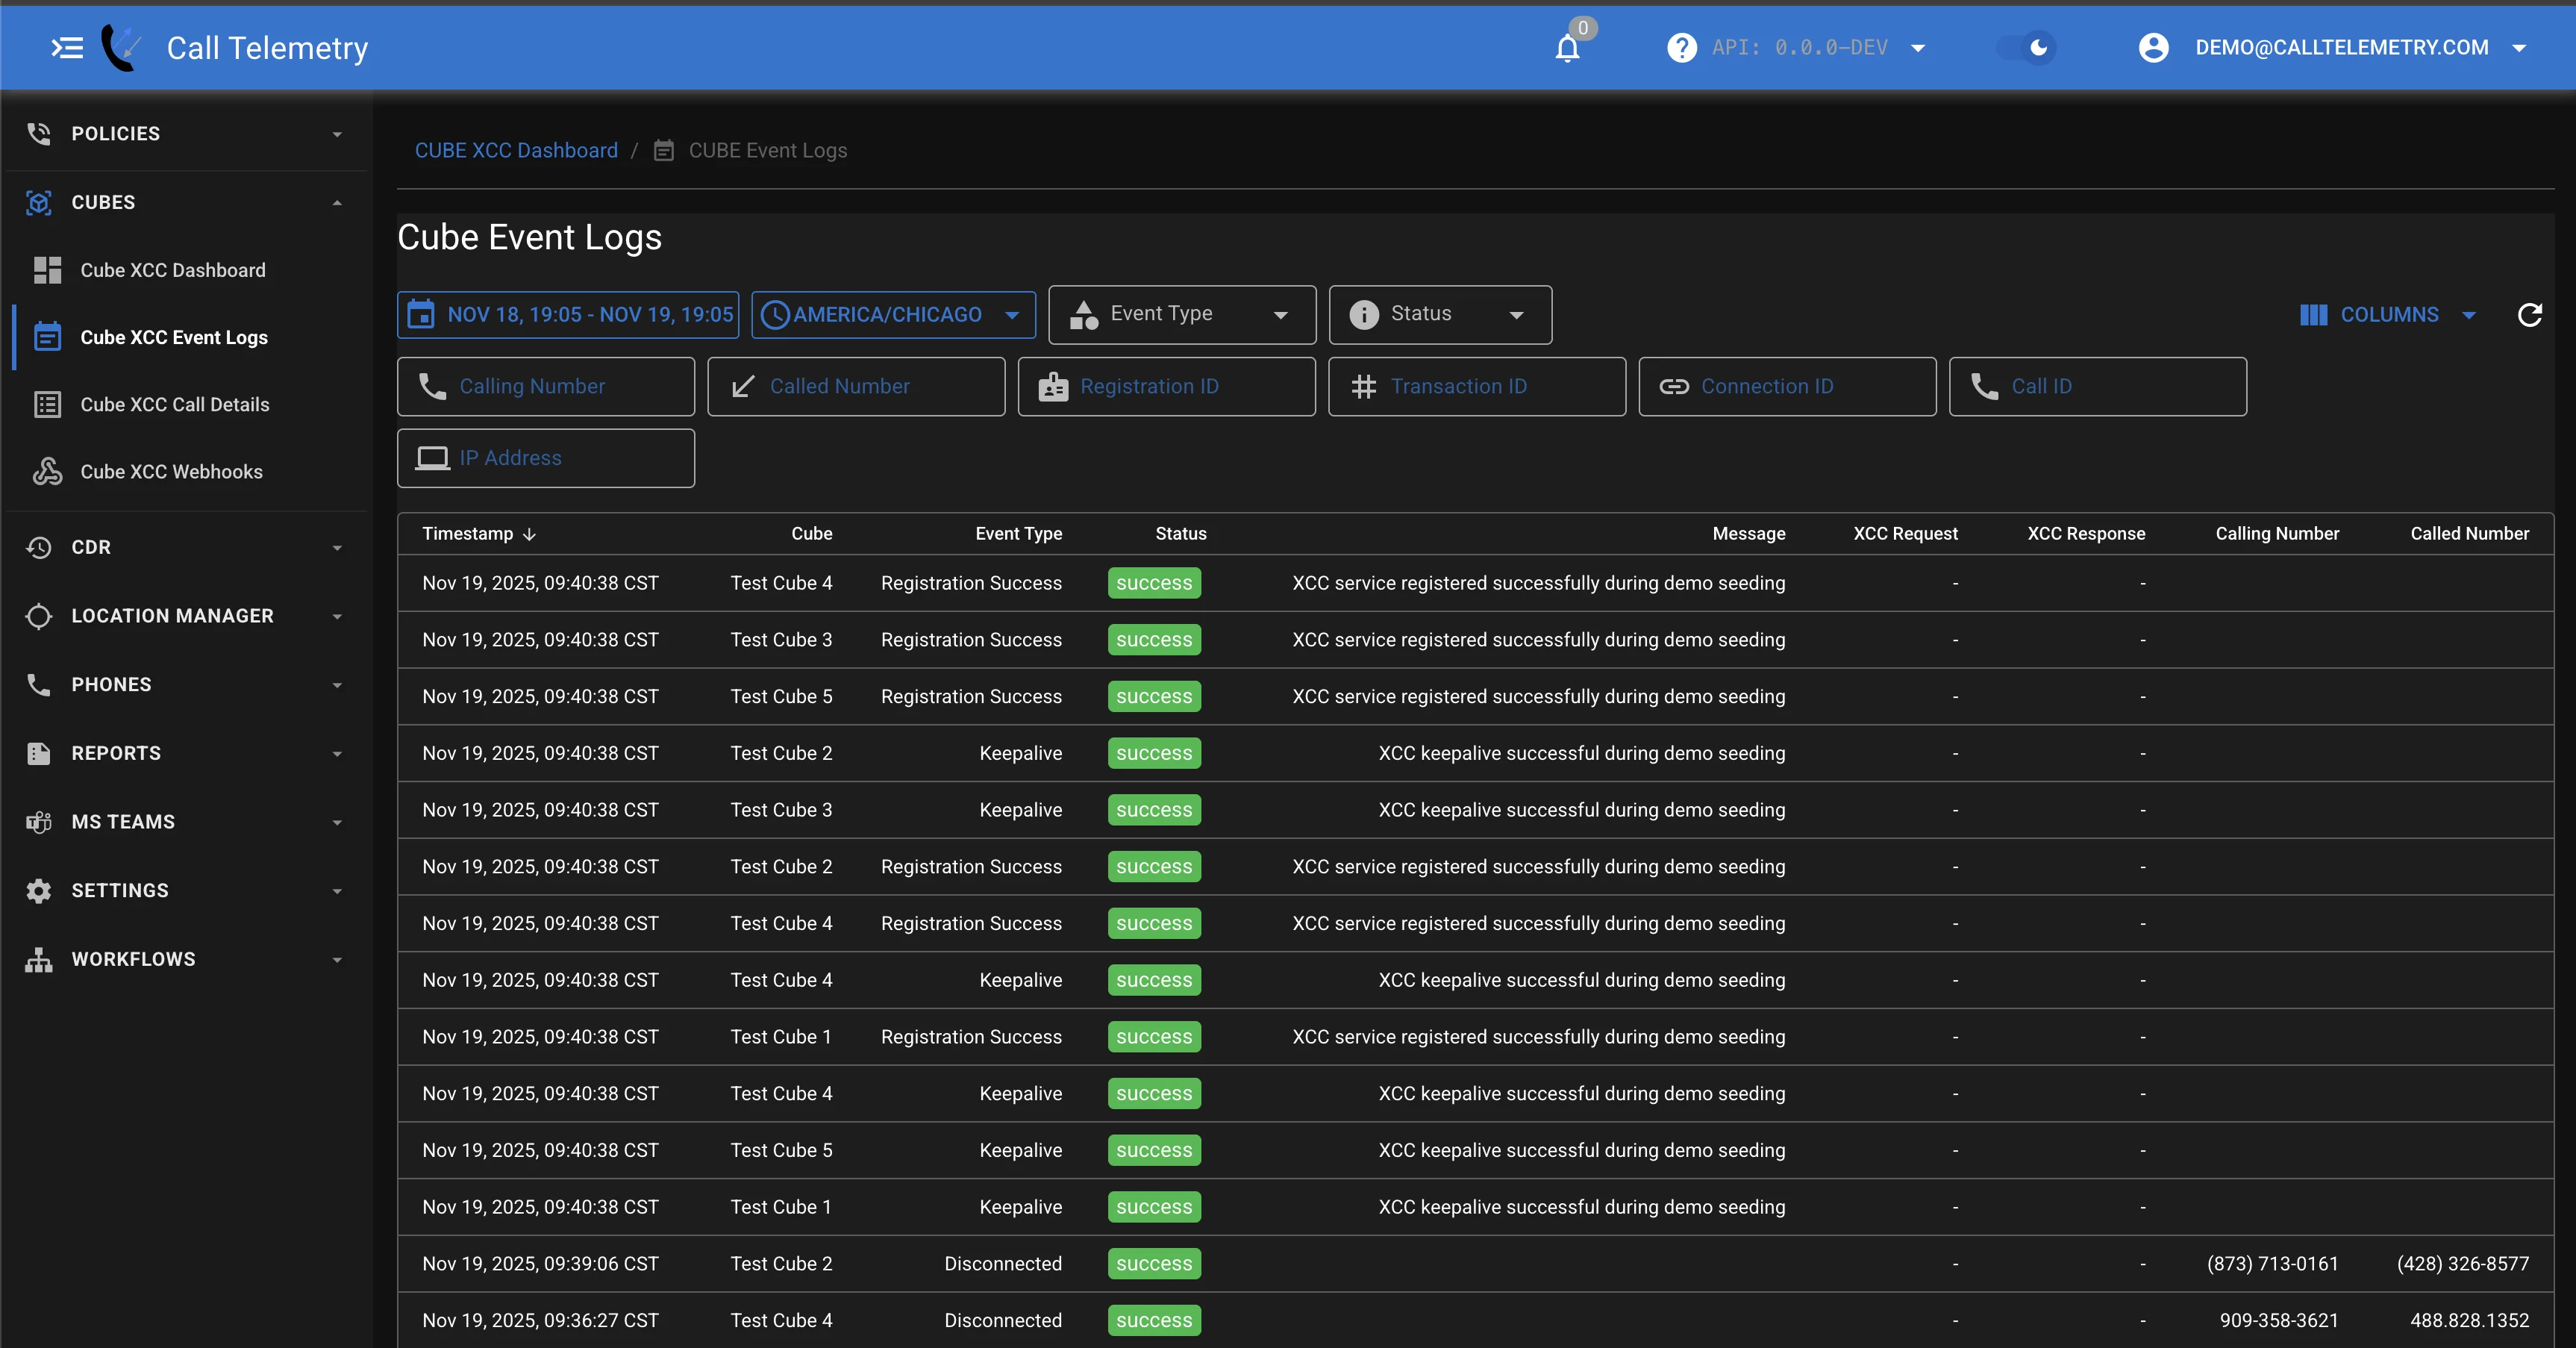
Event Logs include timestamp, event type, status, message, registration and transaction IDs, XCC response, IP address, connection and call IDs, calling/called numbers, and disconnect codes.
Filter by event type, status, or custom conditions when isolating registration or policy issues.
Troubleshooting
- Verify CUBE configuration — XCC settings on the router match Call Telemetry;
remote-urlmatches the Application URL. - Check connectivity — Firewall allows CUBE ↔ Call Telemetry on the ports above; ping or TCP test as needed.
- Review Event Logs — Look for failed registrations or policy timeouts.
- Reconnect — Use Reconnect on the dashboard to force registration.
- IOS debugging —
debug wsapi xcc allon the CUBE while reproducing.