Troubleshooting JTAPI Greeting Injection
Quick Triage
- Is the JTAPI server connected?
- Are CTI ports registered and available?
- Is the target phone/device being monitored?
- Did the policy rule match and request injection?
- Did injection fail due to CUCM/media resources/audio format?
Connection Failures
Symptoms: JTAPI server shows disconnected, no new injection jobs created, CTI ports fail to register.
What to check:
- Network reachability to CUCM (JTAPI default port is
2748) - CUCM services (CTI Manager / JTAPI services enabled and healthy)
- Application User credentials
- CUCM cluster routing (publisher/subscriber selection, DNS, firewall)
telnet <cucm-host> 2748
CTI Port Pool Issues
Pool Exhaustion — Jobs stuck queued/pending, errors indicating no available CTI ports, sustained high pool utilization.
Most common causes:
- CTI pool too small for peak concurrency
- Greetings too long (ports held longer)
- Rules too broad (too many calls trigger injection)
Fixes: increase pool size, reduce greeting duration, or narrow rule scope with allowlists.
Ports Unregistered in CUCM — Check Application User permissions and device association, CUCM device pool / CSS / partition settings for CTI ports, and CTI Manager service health.
Injection Failures
No Jobs Created — Verify the device exists in Controlled Devices and is enabled, has a greeting policy assigned, the policy is enabled, and your rule patterns actually match the call.
Jobs Queued or Stuck — Check CTI pool health and utilization. Verify CTI ports are registered and usable in CUCM.
Job Created But No Audio — If injection jobs complete but the caller hears silence:
- Check the JTAPI Event Log for the job status — look for transcoding errors or timeout messages.
- Verify the ct-media service is running (required for transcoding).
- Confirm MinIO is reachable from both the API and the JTAPI sidecar.
- Check CTI port placement — the port's device pool, CSS, and partition must allow bridging to the target phone.
If audio previews correctly in the UI but calls are silent, the issue is usually CTI/CUCM-side bridging constraints rather than the file itself.
Poor Audio Quality — Greeting injection transcodes all audio to G.711 mu-law (PCMU) at 8kHz mono for RTP playback. Use mono WAV at 8kHz or 16kHz, voice-only content, and short clips (5–15 seconds). Avoid high-bitrate stereo files or heavily compressed MP3s.
Transcoding Failed — Check ct-media pod logs, verify MinIO connectivity, and try re-uploading with a simpler format (mono WAV, 8kHz).
Application User Errors
"Terminal not found" — The device is not in the Application User's Controlled Devices list. In CUCM, edit the Application User, click Device Association, and add the missing device. Alternatively, assign the Standard CTI Allow Control of All Devices role.
"AppUser was not found" — The Application User ID configured in Call Telemetry does not exist in CUCM. Verify the exact User ID in CUCM and correct the username in Settings > JTAPI Servers.
"Authentication failed" — The password is incorrect or the Application User is disabled. Verify the user is enabled in CUCM, reset the password if needed, and update it in Call Telemetry.
Permission Errors (CTI Roles) — Remote control fails with Error 4, cannot register CTI ports, cannot monitor devices. Add the required CTI roles listed in JTAPI Configuration Step 2.
CUCM Audit
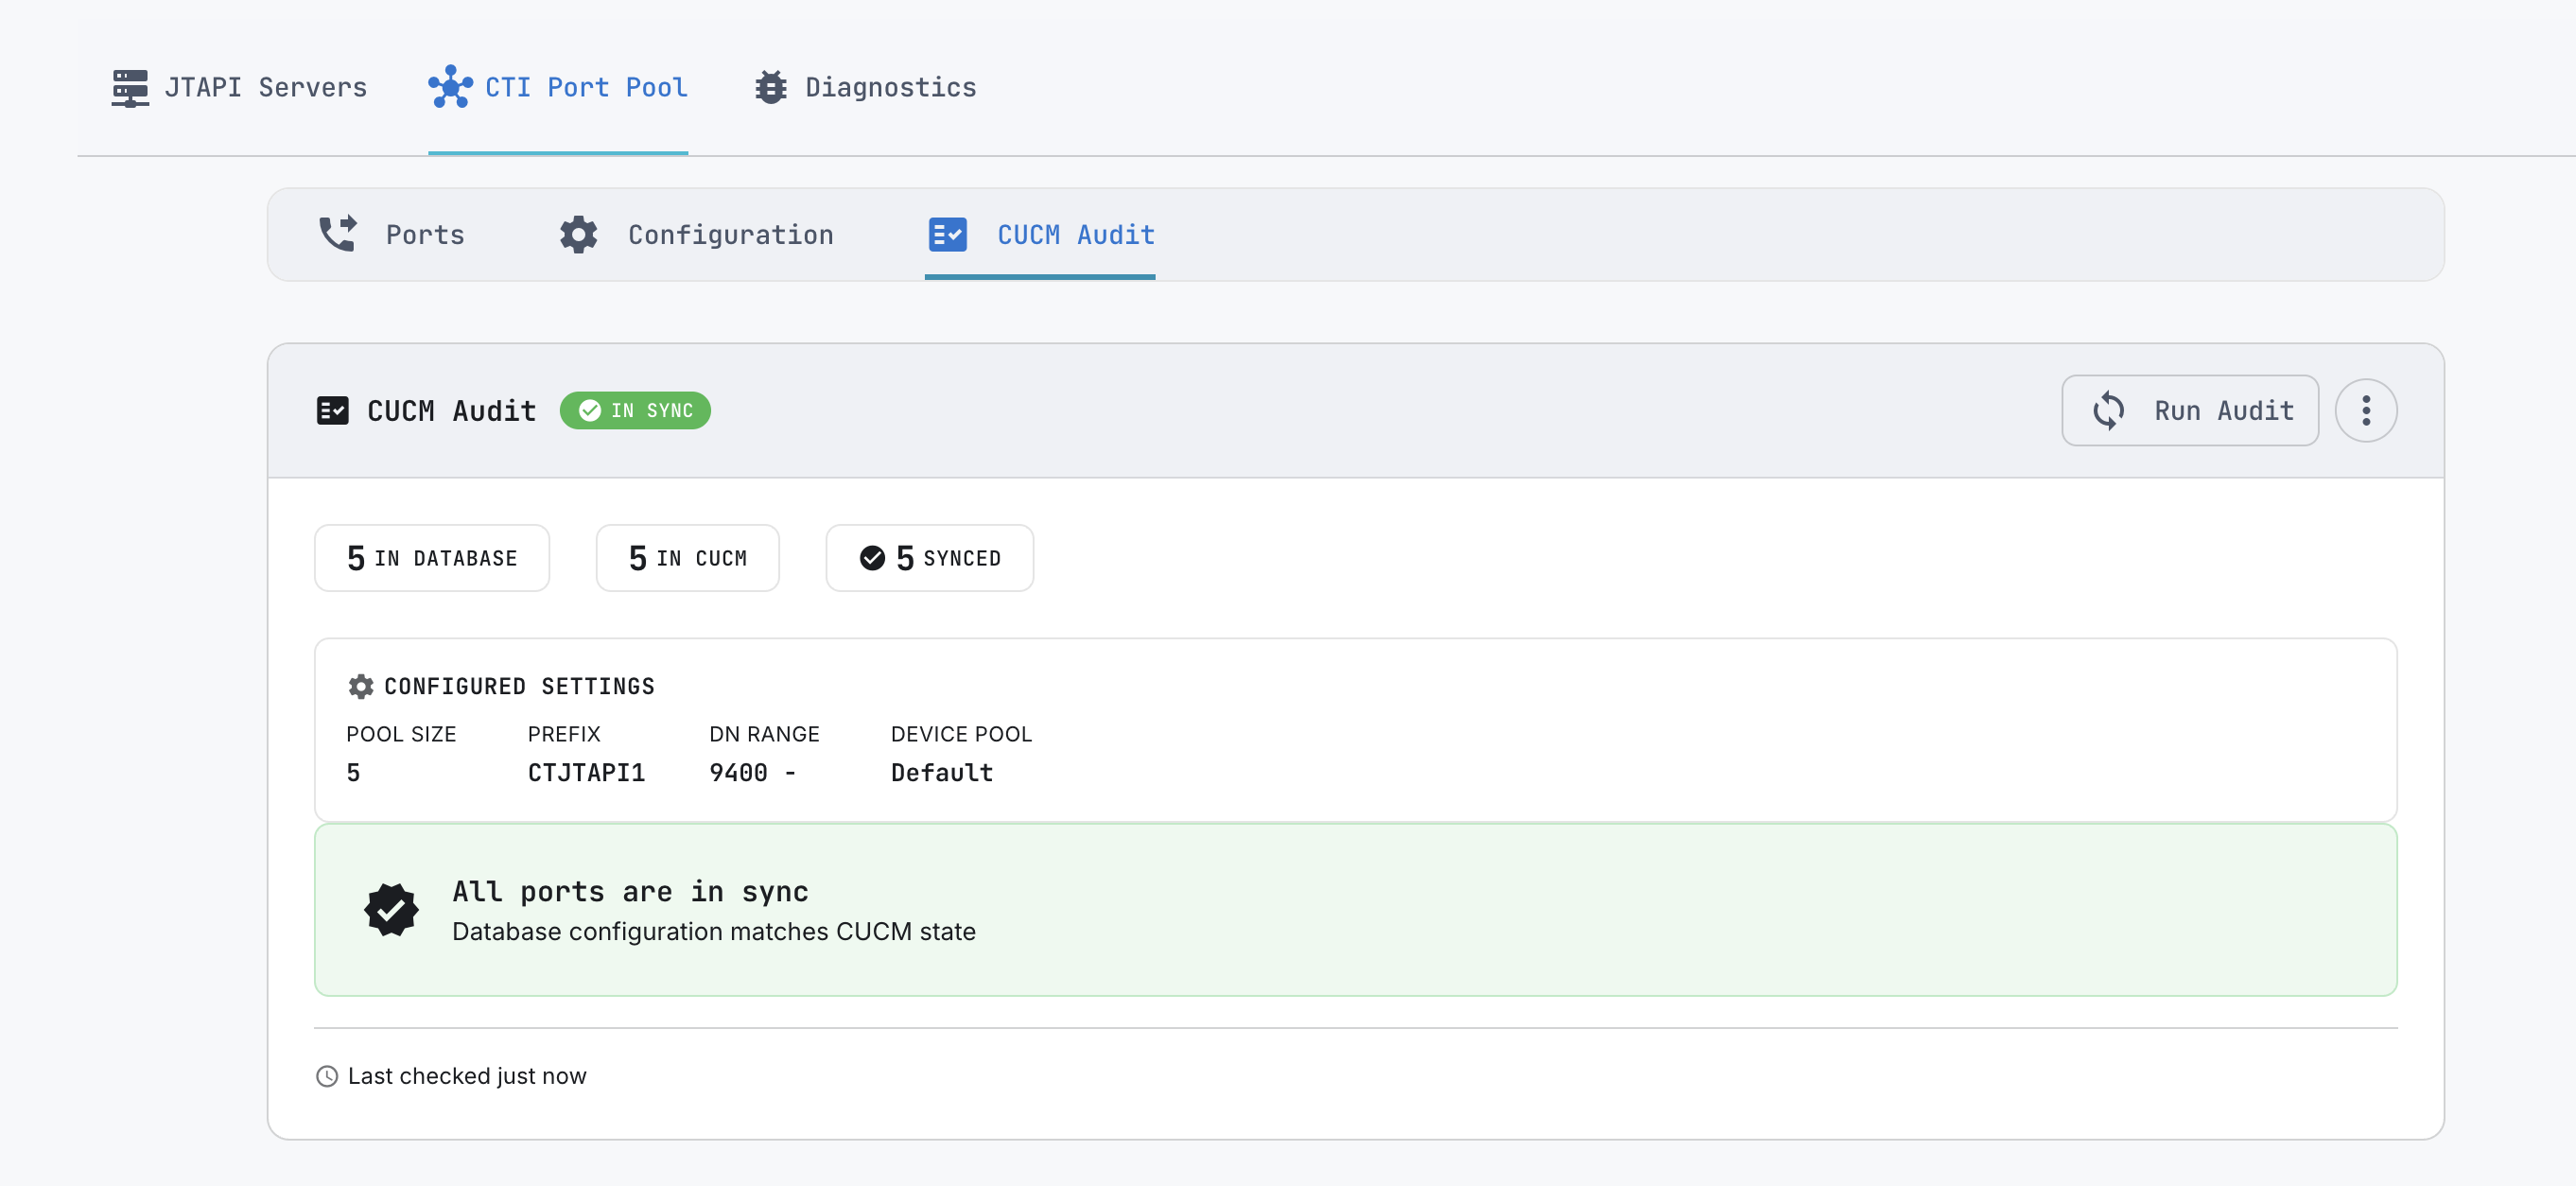
If ports aren't registering or injection is failing, the CUCM Audit tab on the CTI Pool page compares your Call Telemetry database against the live CUCM state. Click Run Audit to start.
The audit summary shows port counts in each state — In Database, In CUCM, Synced, and Issues — along with the configured settings (pool size, prefix, DN range, device pool, partition, CSS) so you can verify the expected configuration at a glance.
Issue Types
| Issue | Meaning |
|---|---|
| Missing in CUCM | Port exists in the database but not in CUCM — needs to be reprovisioned |
| Extra in CUCM | Port exists in CUCM but not in the database — can be imported or removed |
| DN Mismatch | Directory number in the database doesn't match what CUCM has for that port |
| DN Out of Range | Port's directory number falls outside the configured DN range |
| Device Pool Mismatch | Port is registered to a different device pool than configured |
| Partition Mismatch | Line partition doesn't match the configured value |
| CSS Mismatch | Calling search space differs from configuration |
For mismatch issues, the audit shows a side-by-side comparison of the Configured value vs the Actual value in CUCM.
Fixing Issues
When issues are found, click Fix Issues to open the fix dialog. You can selectively enable:
- Create missing ports — reprovision ports that are missing from CUCM
- Remove extra ports — clean up database records for ports no longer in CUCM
- Fix DN mismatches — update directory numbers to match the configured range
- Sync all from CUCM — override the database with whatever CUCM currently has (use with caution)
For "Terminal not found" errors specifically, use Repair Port Associations from the overflow menu — this re-associates ports with the Application User in CUCM without changing any other configuration.
Capture a Show-Tech Bundle Before Applying Fixes
When the audit reports issues, capture the current state before you select Fix Issues. Navigate to Greeting Injection > JTAPI Infrastructure > Diagnostics, then click Download support bundle.
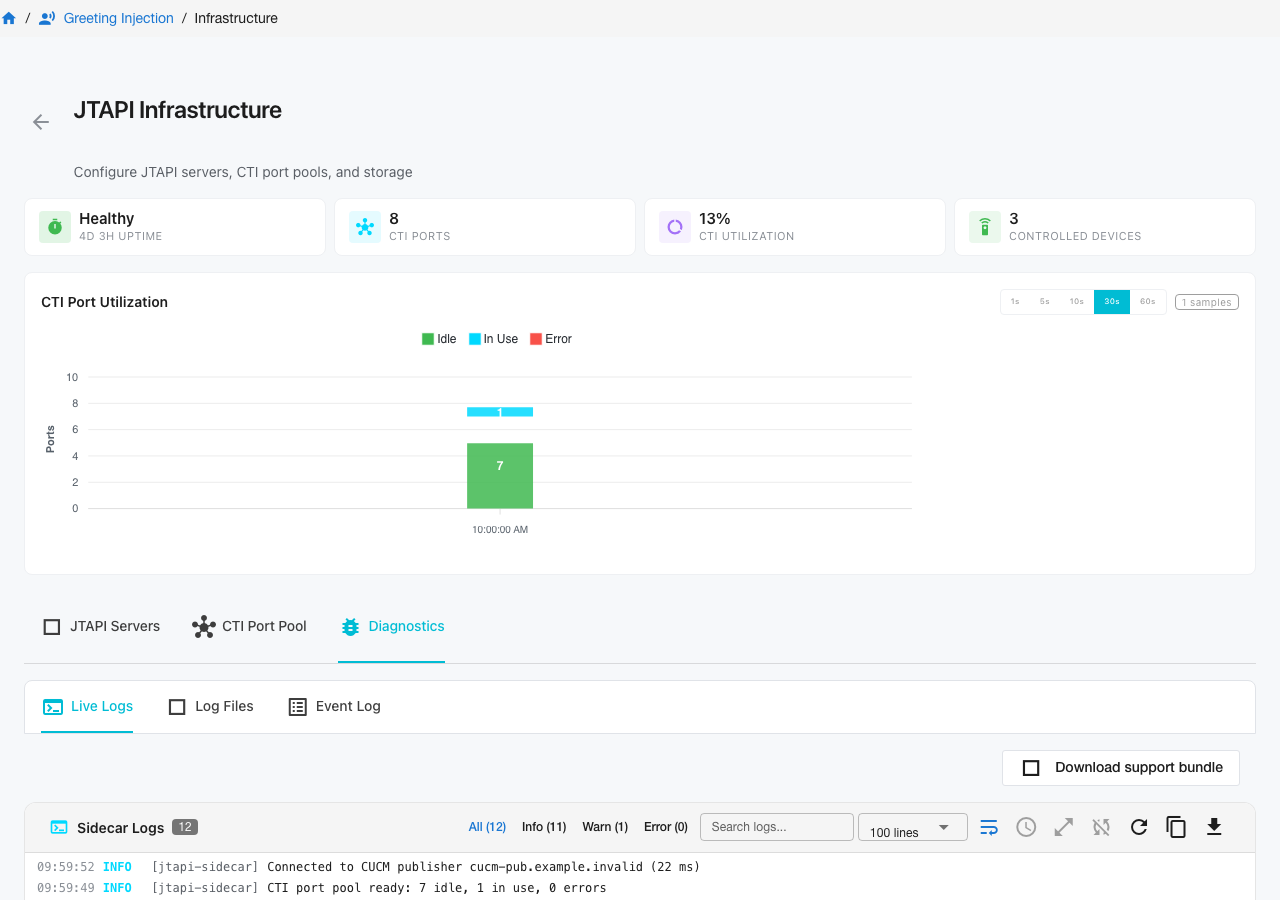
The downloaded jtapi-show-tech-<timestamp>.zip contains redacted live diagnostics, JTAPI provider and CTI port state, recent events and call timelines, the sidecar application logs, and Cisco JTAPI trace files. Collecting it before remediation preserves the evidence support needs to correlate an audit mismatch with the sidecar and CUCM behavior that produced it.
Generate the bundle immediately after reproducing the problem when possible. Recent events are retained in memory and log files can rotate, so a bundle collected later may not contain the complete failure window.
Diagnostics
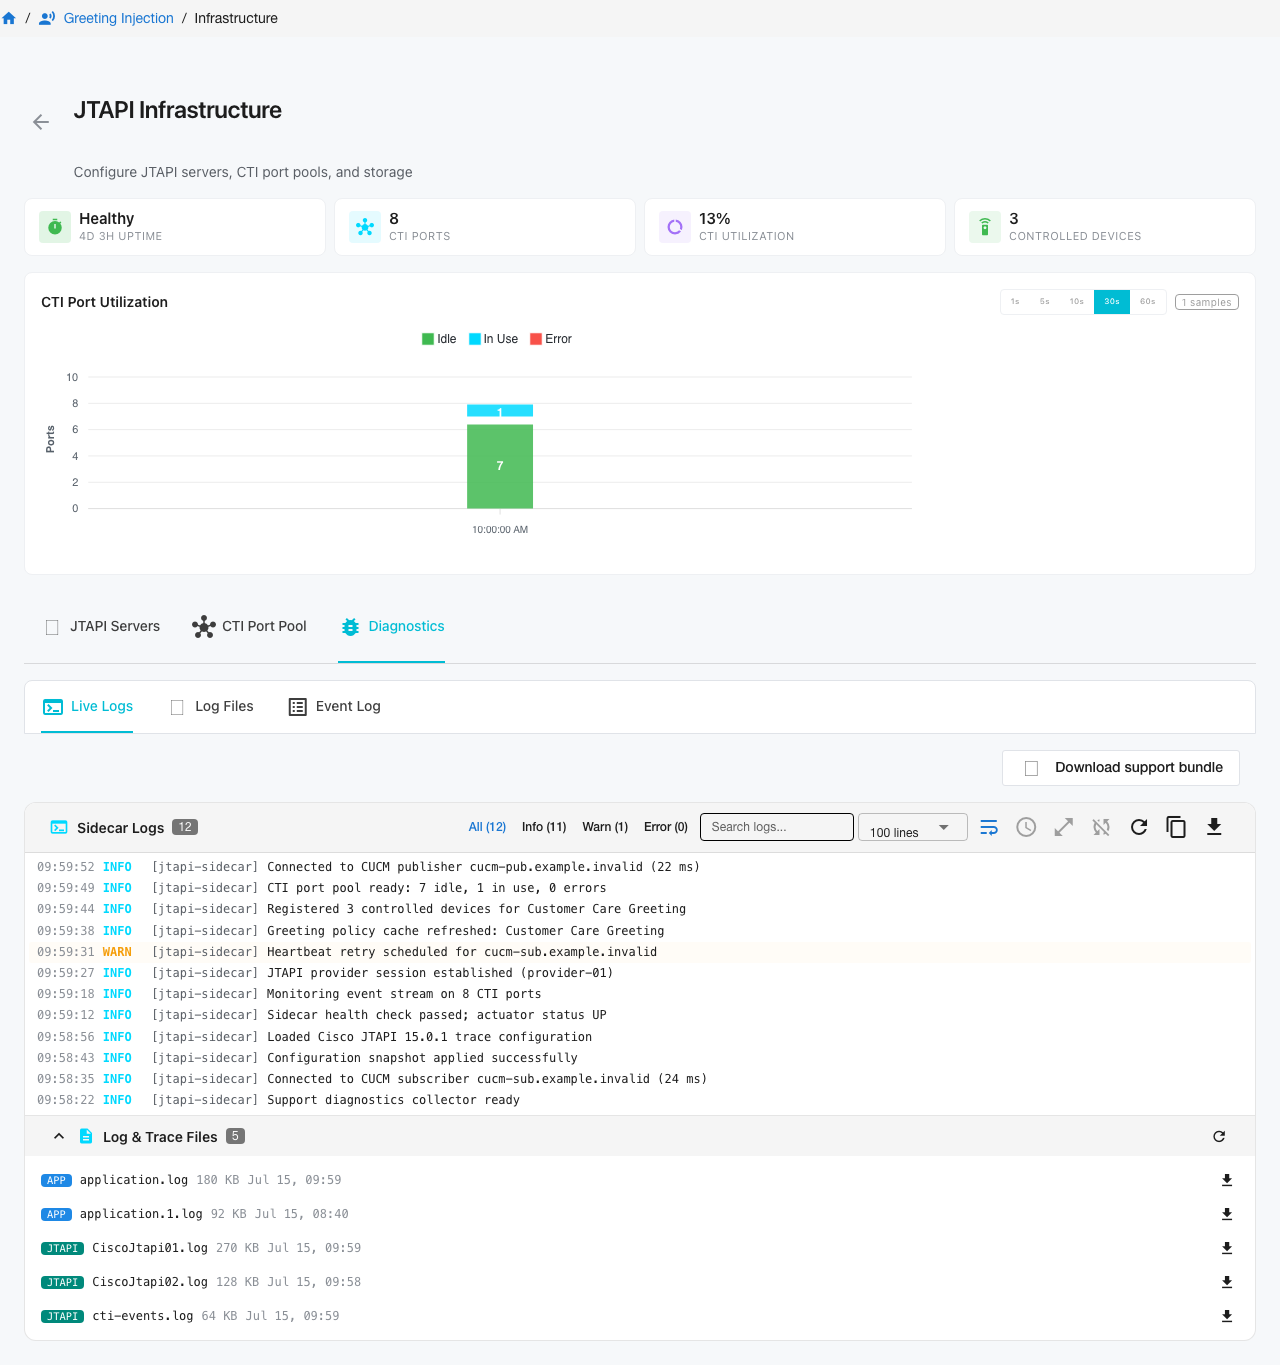
The Diagnostics tab on the JTAPI Infrastructure page provides log collection and trace access for troubleshooting.
Live Logs
Streams real-time sidecar logs directly in the browser. Use this for active troubleshooting while reproducing an issue.
- Filter by level — toggle between All, Info, Warn, and Error to isolate relevant entries
- Search — filter log lines by keyword (e.g., a device name or error message)
- Line limit — control how many lines are displayed (100, 500, 1000)
- Actions — expand to full screen, copy all visible logs to clipboard, or download as a file
Log Files
Lists the JTAPI sidecar log and Cisco JTAPI trace files stored on the sidecar. Each file shows its size and last modified timestamp.
| File | Contents |
|---|---|
| application.log | Sidecar application log — connection events, injection operations, errors |
| CiscoJtapi01.log – CiscoJtapi0N.log | Cisco JTAPI provider trace files — low-level CTI protocol messages between the sidecar and CUCM |
Click the download icon on any file to save it locally. These are the files support will ask for when diagnosing CUCM-side issues.
JTAPI Event Log
The JTAPI Event Log (navigate to Greeting Injection > JTAPI Infrastructure > Event Log) provides real-time visibility into call-leg events and injection decisions.
- Event Statistics — total event counts broken down by type: Call State Change, Injection Decision, and Injection Outcome. Use the time filter to scope to the relevant window.
- Live Event Feed — streams events in real time as calls arrive on controlled devices. Filter by category (Calls, Injections, Decisions, Ports) to isolate what you need. Pause the feed to inspect specific entries.
Call Thread Detail
Click any event in the Event Log to open the Call Thread view. This shows the full call flow as a ladder diagram with an event timeline.
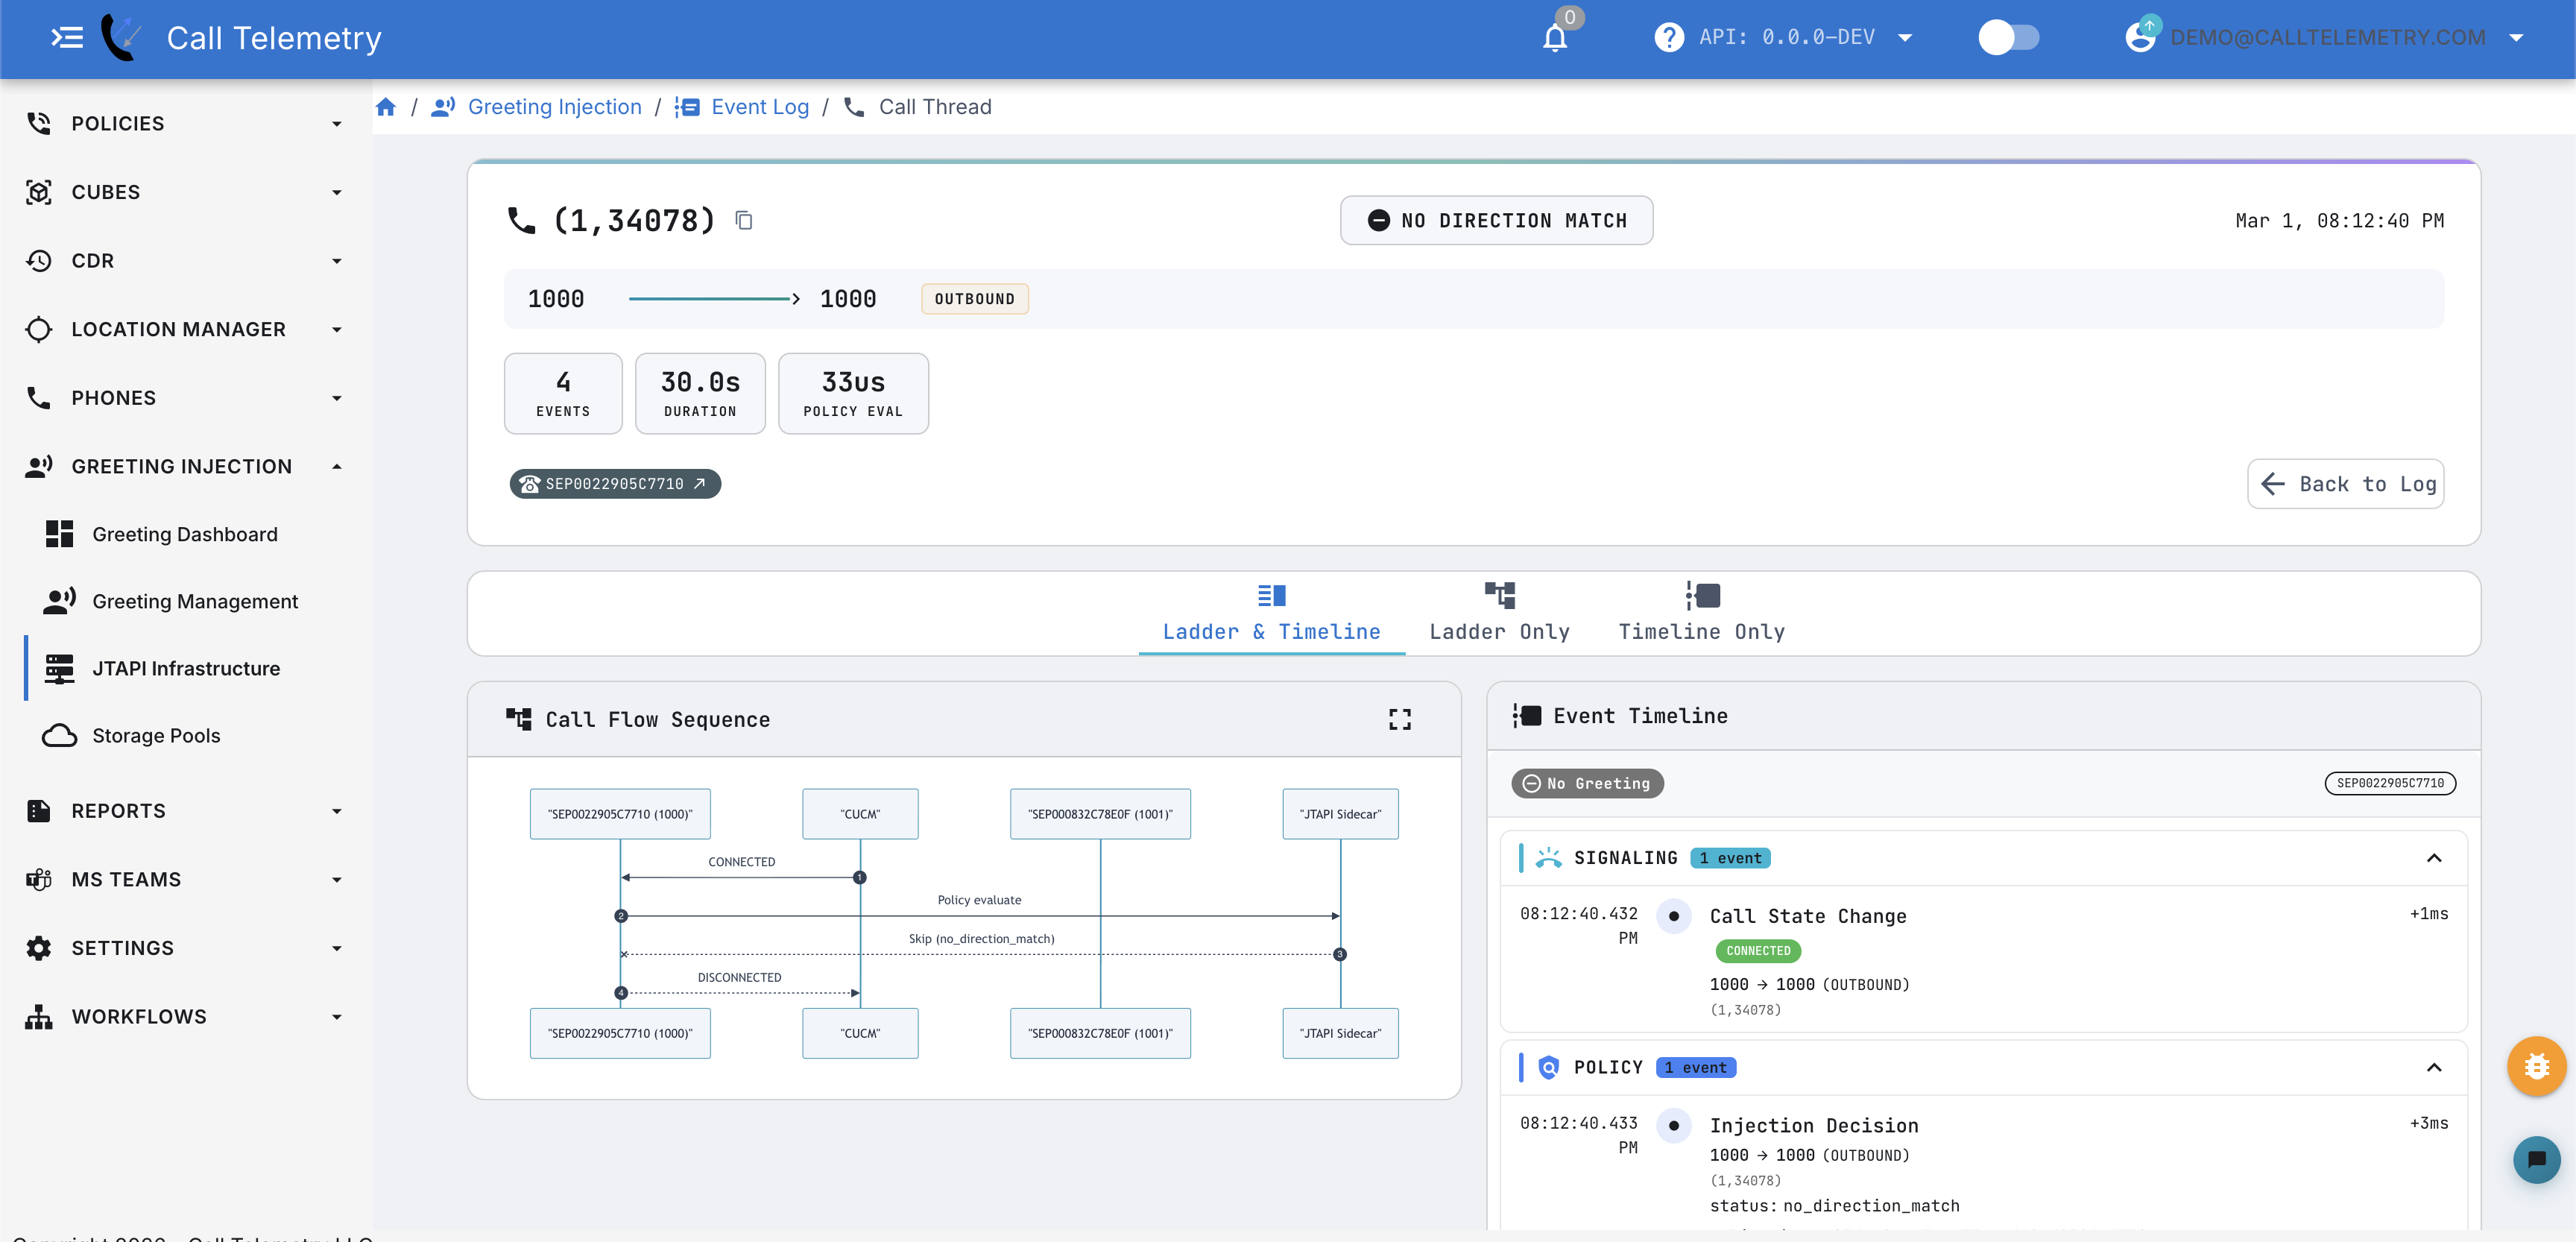
The ladder diagram shows message flow between participants (phones, CUCM, JTAPI Sidecar) while the Event Timeline on the right breaks down each signaling and policy event with timestamps. Use this to trace exactly what happened — whether a policy matched, why injection was skipped, or where a failure occurred.
What to Collect for Support
When opening a support case, gather the following from the Diagnostics tab:
- JTAPI show-tech support bundle — reproduce the issue, then click Download support bundle before applying CUCM Audit fixes
- application.log — download from Log Files if support requests the standalone log
- Relevant CiscoJtapi trace files — download the traces covering the timeframe of the issue if support requests them separately
- Live Logs screenshot or export — filtered to the error level around the time of the failure
- CTI pool stats — Total, Idle, In Use, Error counts from the Ports tab
- JTAPI Event Log — filter to the timeframe of the failure to capture injection decisions and outcomes