Cisco Call Quality Reports and Dashboards
EssentialsCall Management Records (CMR) provide the raw voice quality metrics needed to diagnose audio complaints and troubleshoot network performance issues. While CDRs tell you who called whom, CMRs tell you how that call sounded on the wire.
Call Telemetry processes these records in real-time to build a comprehensive view of your audio environment:
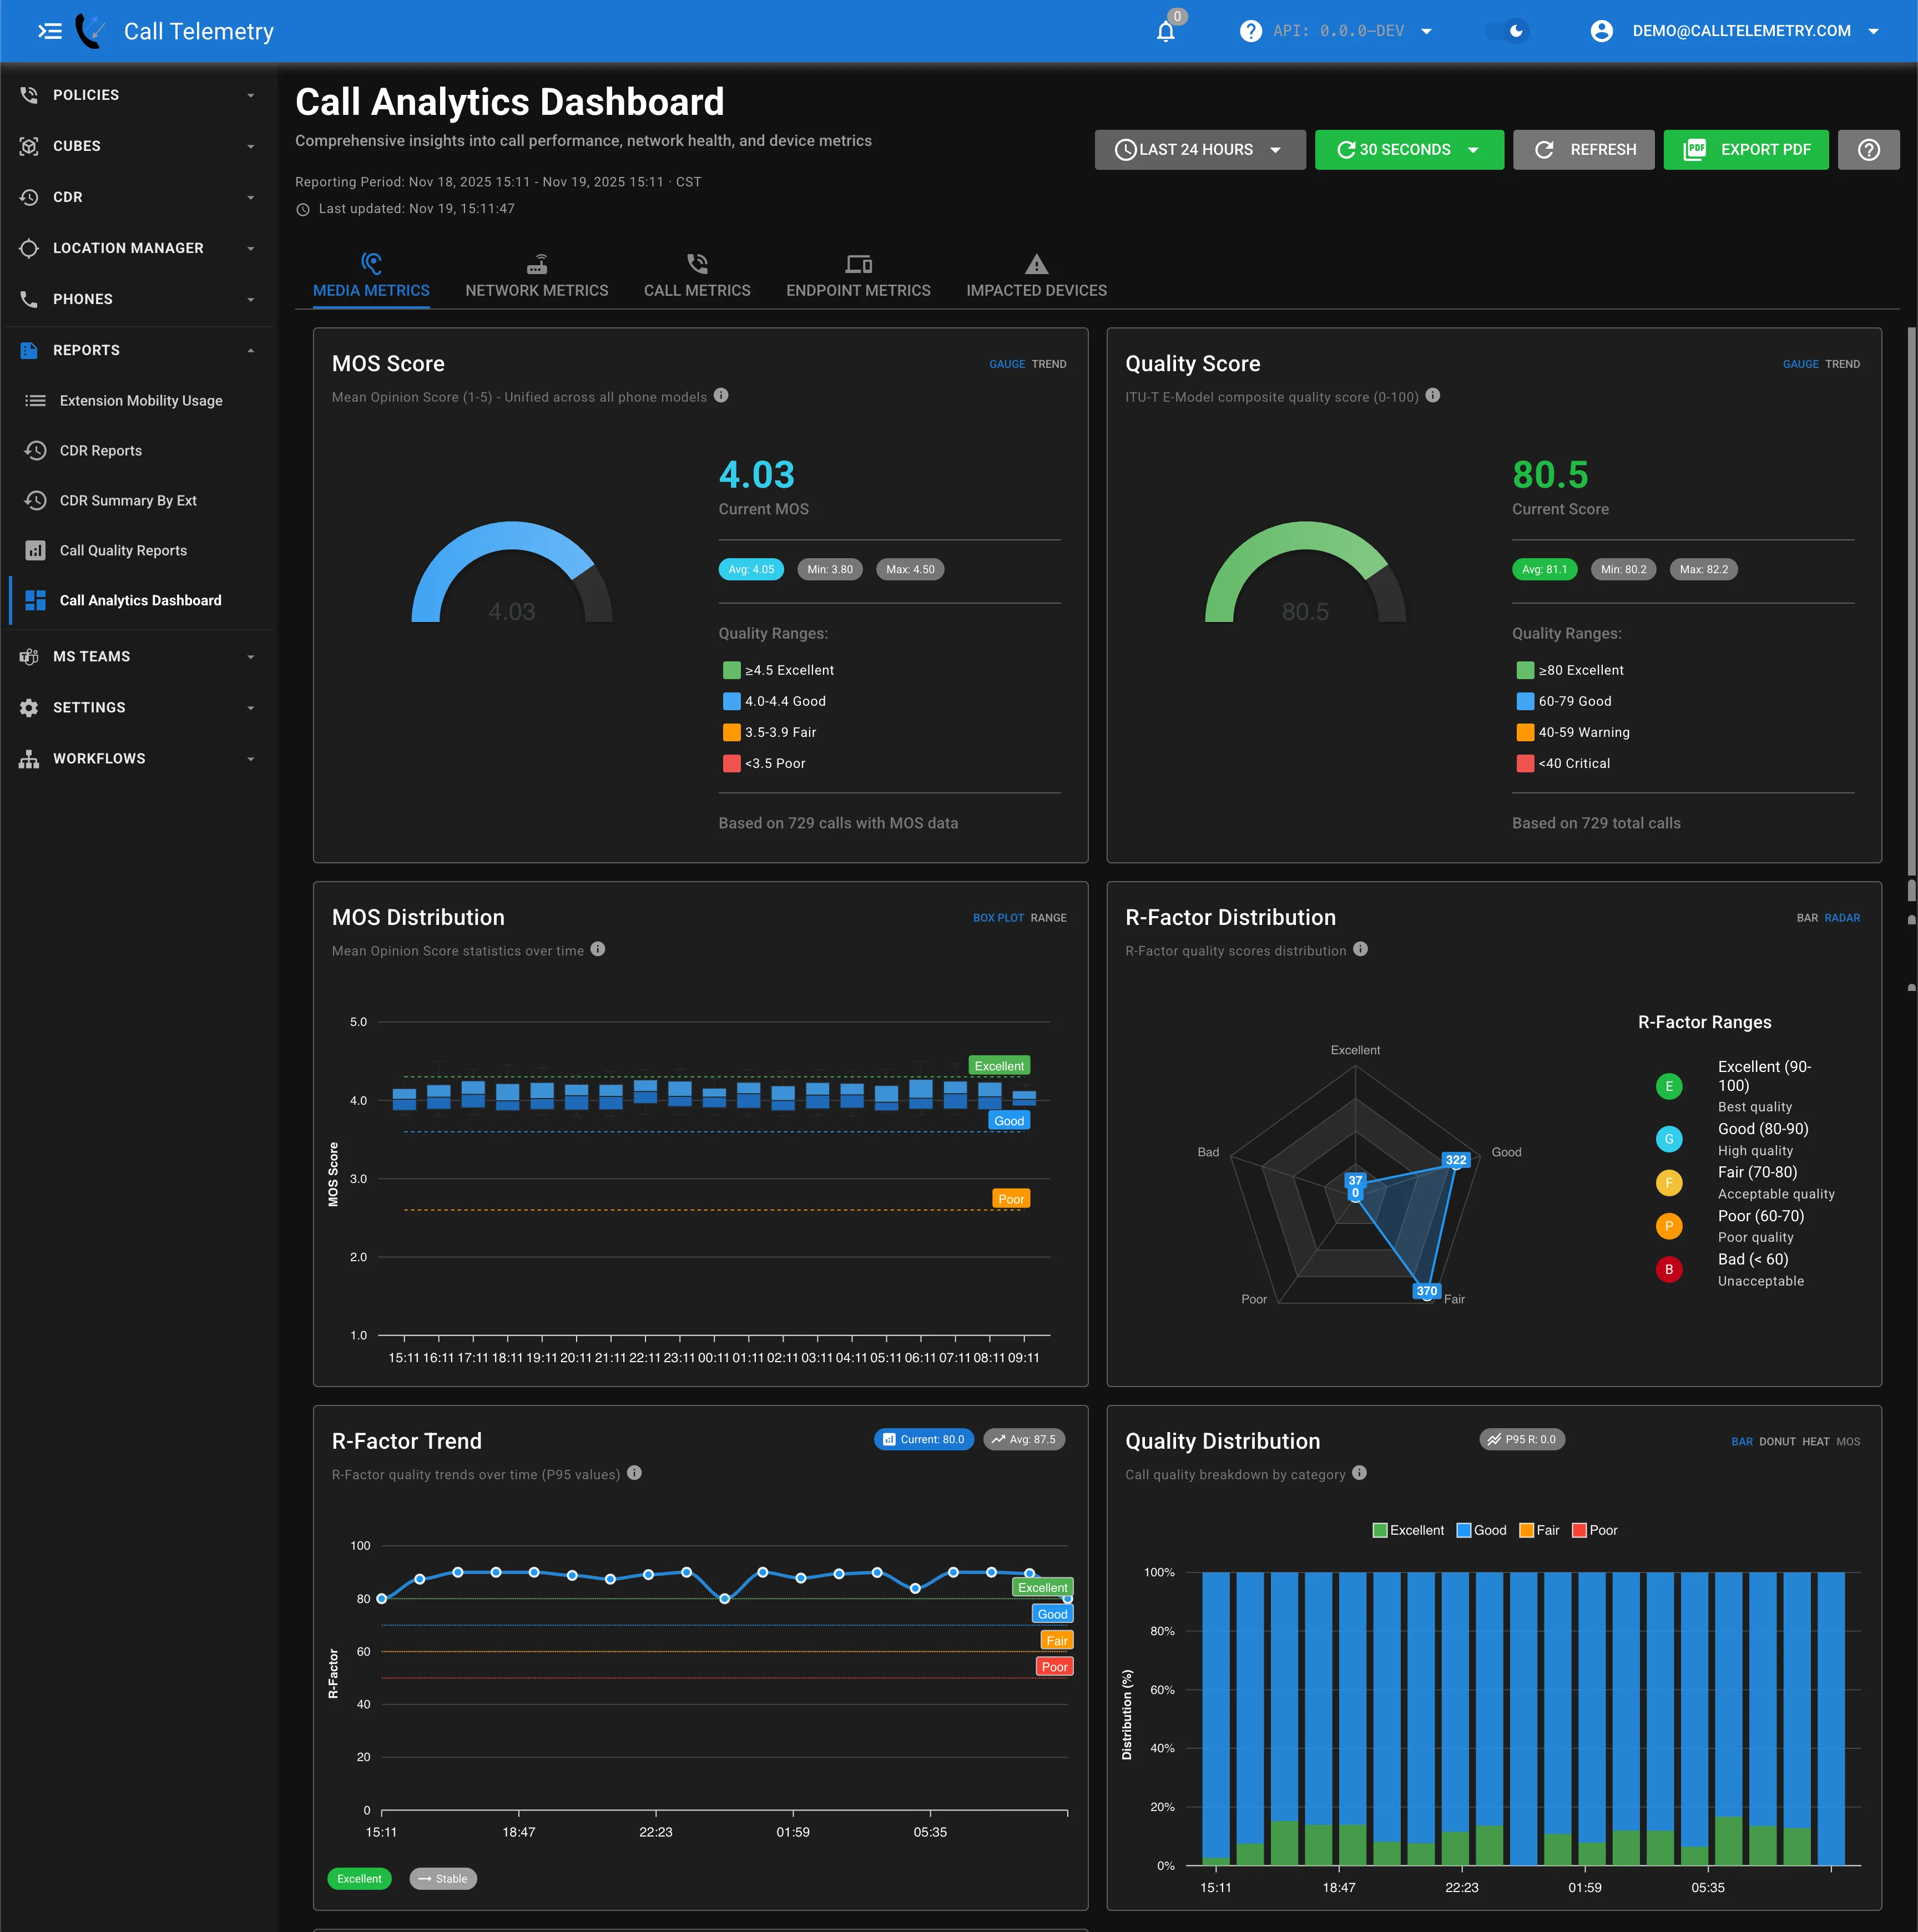
- Diagnose Quality Issues: Quickly isolate audio concealment, jitter, and packet loss problems.
- Identify Bad Endpoints: Spot hardware or firmware issues across your phone inventory.
- Trend Network Health: Monitor organizational MOS scores to baseline performance.
- Correlate with CDR: Match quality metrics to specific call detail records for a complete root-cause analysis.
For analytics, see Reporting Overview. For raw call data, see CDR Reporting.
To route a post-call notification when a linked CMR crosses a selected threshold, use the Voice Quality, Network Jitter, or Packet Loss guides. Reports remain the place to compare those matches with broader device, site, and network patterns.
CMR Reporting Features
- Call Quality Metrics: View detailed quality metrics including MOS, audio concealment, latency, and jitter
- Historical Trending: Analyze call quality trends over time to identify patterns and issues
- Advanced Filtering: Filter by date ranges, quality thresholds, and other parameters
- Correlation with CDR: View call quality metrics with call detail records for comprehensive analysis
- Export Options: Export reports to CSV for further analysis
- Quality Alerts: Set thresholds for quality metrics to receive alerts on poor call quality
Feature Requirements
- Call Telemetry Appliance version 0.8.4 or later
- Call Telemetry Essentials License or higher
- CMR SFTP Integration with Cisco Callmanager
Licensing Limits
- Community Edition: Basic metrics with 1 day metrics retention
- Essentials and above: Full features with unlimited metrics retention
For licensing details, visit Call Telemetry Licensing
Understanding Call Quality Metrics
Mean Opinion Score (MOS)
MOS is a numerical measure of the perceived quality of media after compression and transmission. The score ranges from 1 (very poor / unaccetpable) to 5 (excellent).
- 4.3-5.0: Excellent quality, no perceptible issues
- 4.0-4.3: Good quality, barely perceptible issues
- 3.6-4.0: Fair quality, slightly annoying
- 3.1-3.6: Poor quality, annoying
- 2.6-3.1: Bad quality, very annoying
- 1.0-2.6: Unacceptable quality
Concealment Metrics
Concealment metrics measure how effectively the system handles packet loss by "concealing" the missing audio:
- Concealment Ratio: Percentage of concealed audio relative to total audio
- Concealment Seconds: Number of seconds that contain concealed audio
- Severely Concealed Seconds: Number of seconds with high concealment, indicating significant packet loss
Lower values indicate better call quality.
Latency
Latency measures the time it takes for audio to travel from the speaker to the listener. For voice communications:
- < 150ms: Excellent, no noticeable delay
- 150-300ms: Good, slight delay but acceptable
- > 300ms: Poor, noticeable delay affecting conversation flow
Jitter
Jitter is the variation in packet arrival time, which can cause audio quality issues:
- < 20- 50ms: Excellent quality
- 20-100ms: Good quality
- > 100ms: Poor quality, more likely to the delays calling parties will notice
Setting Up CMR SFTP Integration
CMR Call Quality data is received from Cisco Callmanager via SFTP. Follow these steps to set up the integration:
- Enable CDR and integrate with Call Telemetry - CDR Integration guide
- Enable Call Diagnostics on Callmanager:
- Navigate to Cisco Unified CM Administration > System > Service Parameters
- From the Server drop-down list, select the server running the Cisco CallManager service
- From the Service drop-down list, select Cisco CallManager
- In the Clusterwide Parameters (Device - General) section, locate the Call Diagnostics Enabled parameter
- Select Enabled Only When CDR Enabled Flag is True: CMRs are generated only when CDR is enabled
- Click Save to apply your changes
Accessing CMR Call Quality Dashboard
Access Call Quality Reports from the main menu:
- Navigate to Reports in the sidebar
- Select Call Quality Dashboard
- The default view shows the last 24 hours of call metric data
Call Quality Dashboard
This dashboard provides a high level view of call quality metrics across your environment:
High Level Metrics
- Quality Score
- Average MOS Score
- Total Calls
- Poor Calls
Network Performance Metrics
- Average Jitter
- Average Latency
- Packet Loss rate for endpoints
MOS Score Trend
The top chart displays MOS (Mean Opinion Score) values over time, showing how voice quality fluctuates throughout the reporting period. Use this to identify time periods when quality degraded.
Problem Indicators
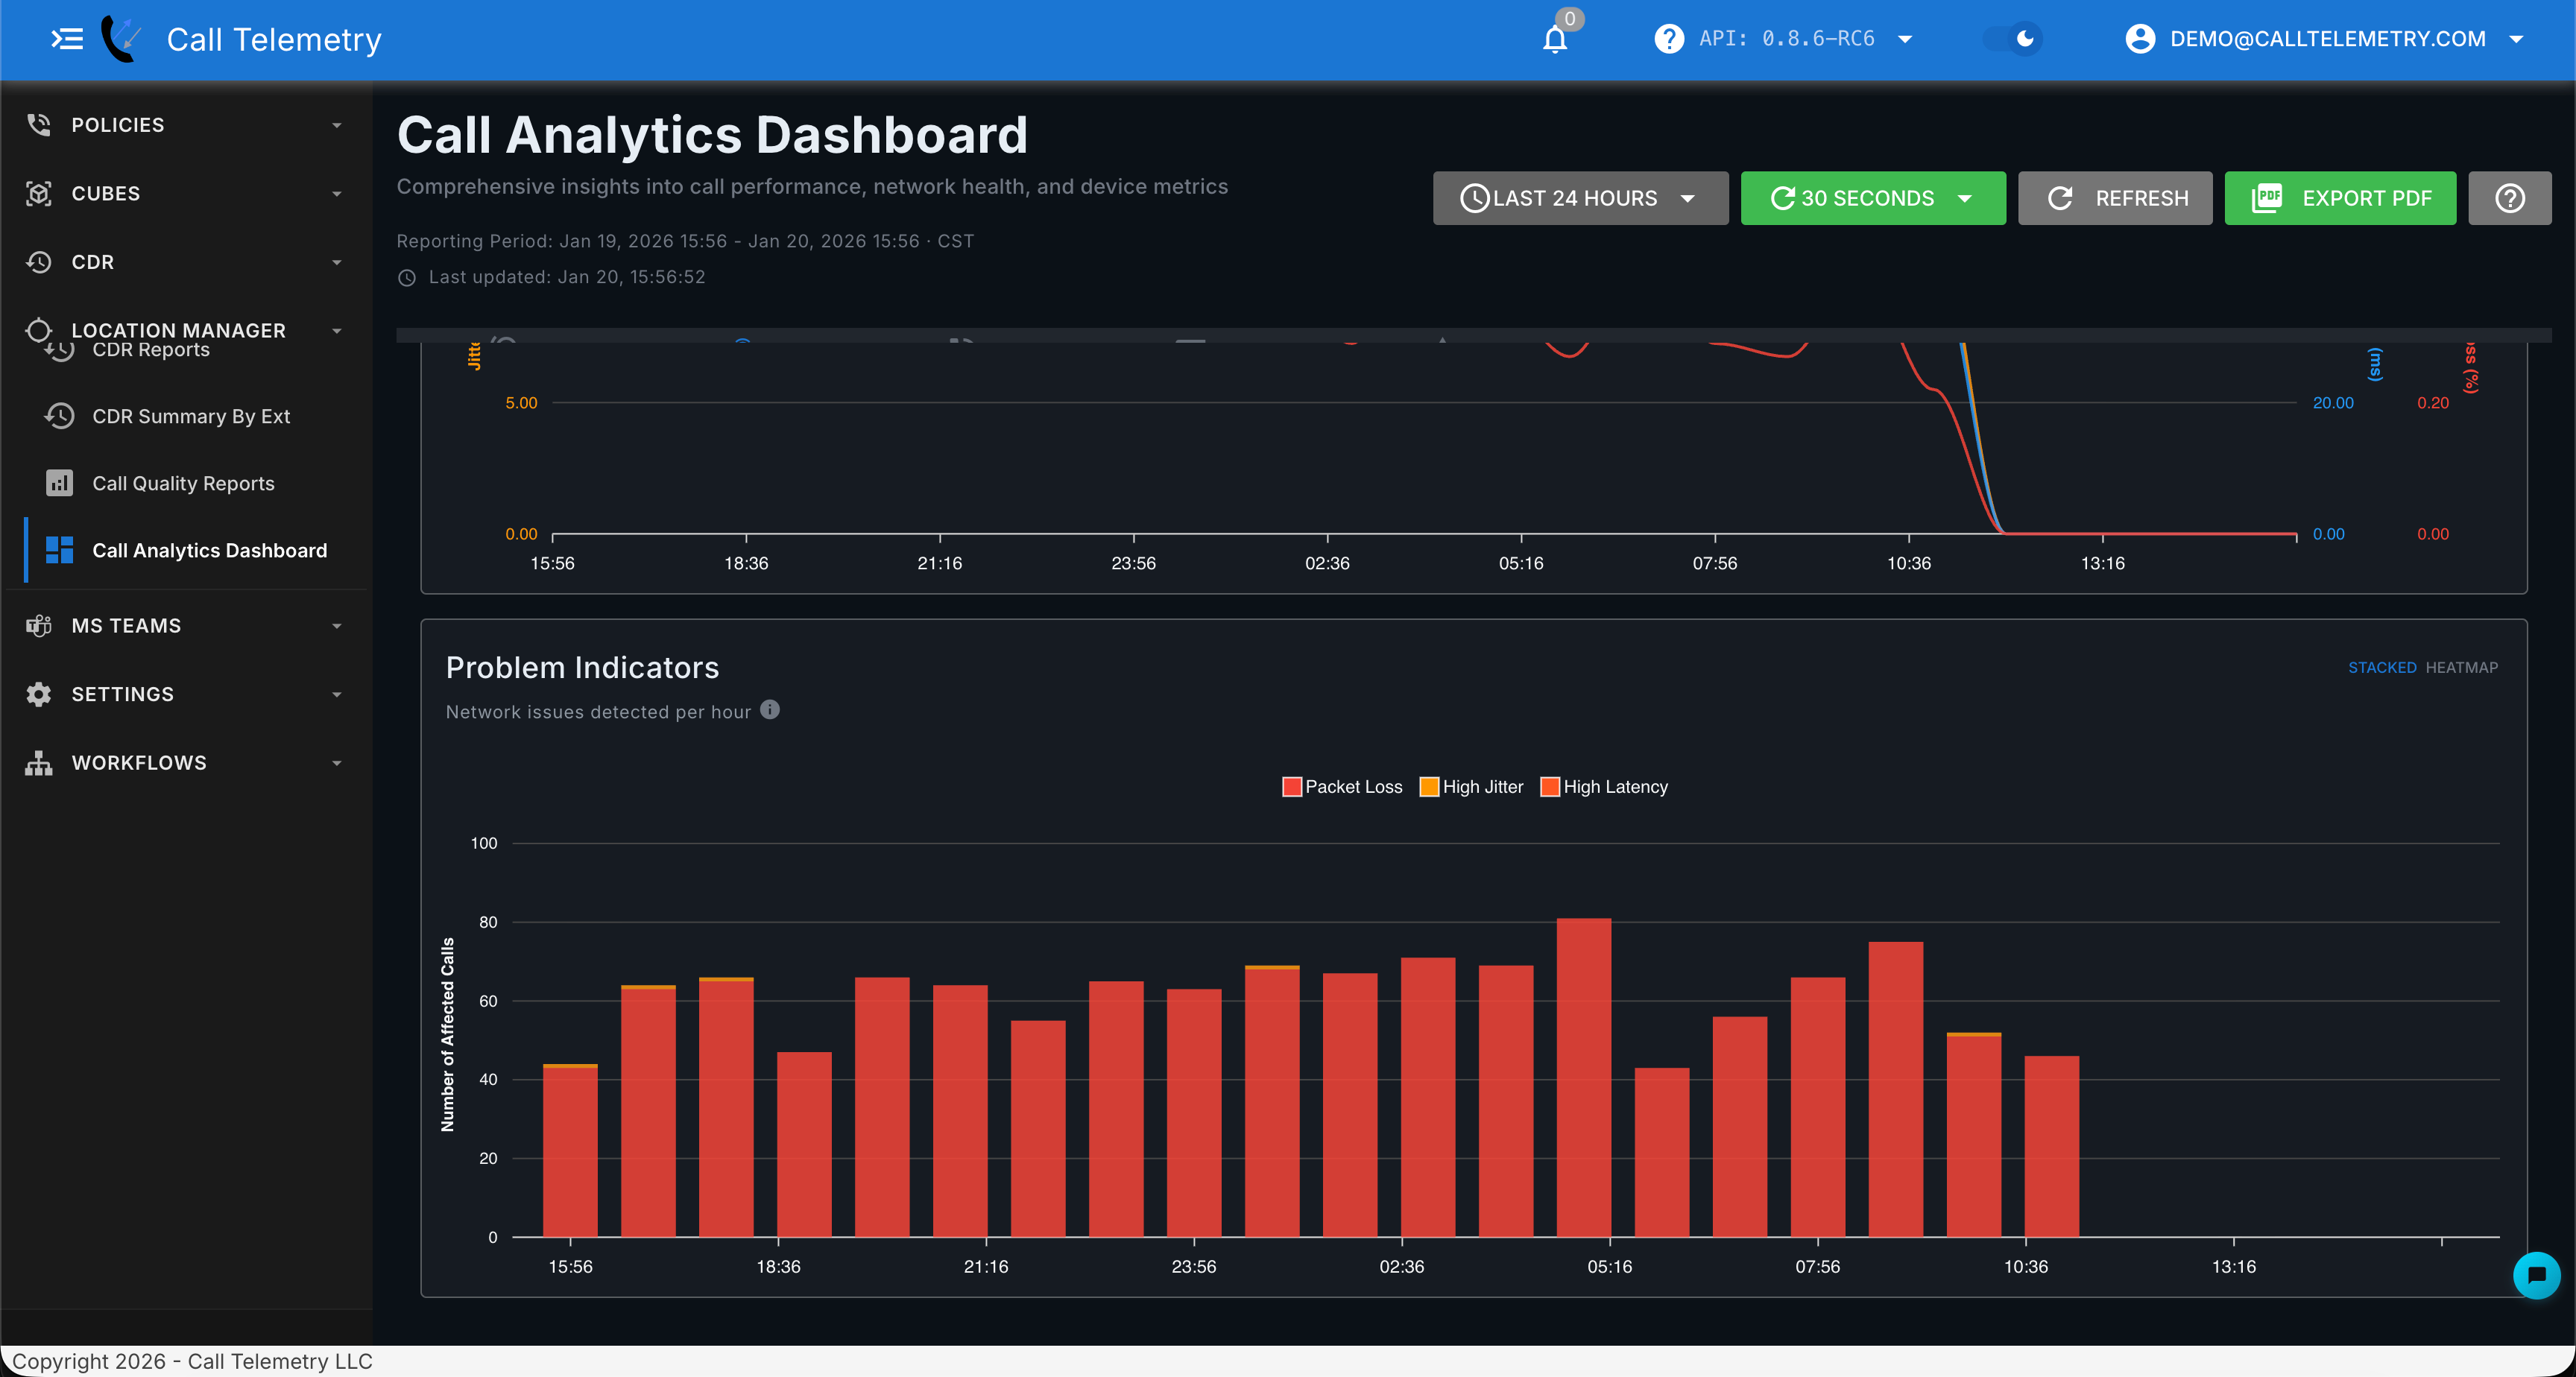
The Problem Indicators chart shows network issues detected per hour, color-coded by issue type:
| Color | Issue | Description |
|---|---|---|
| Red | Packet Loss | Calls affected by dropped packets |
| Yellow | High Jitter | Calls with excessive packet timing variation |
| Orange | High Latency | Calls experiencing audio delay |
Toggle between Stacked and Heatmap views to visualize the data differently. Stacked bars show total affected calls, while heatmap highlights intensity patterns over time.
Call Metrics Tab
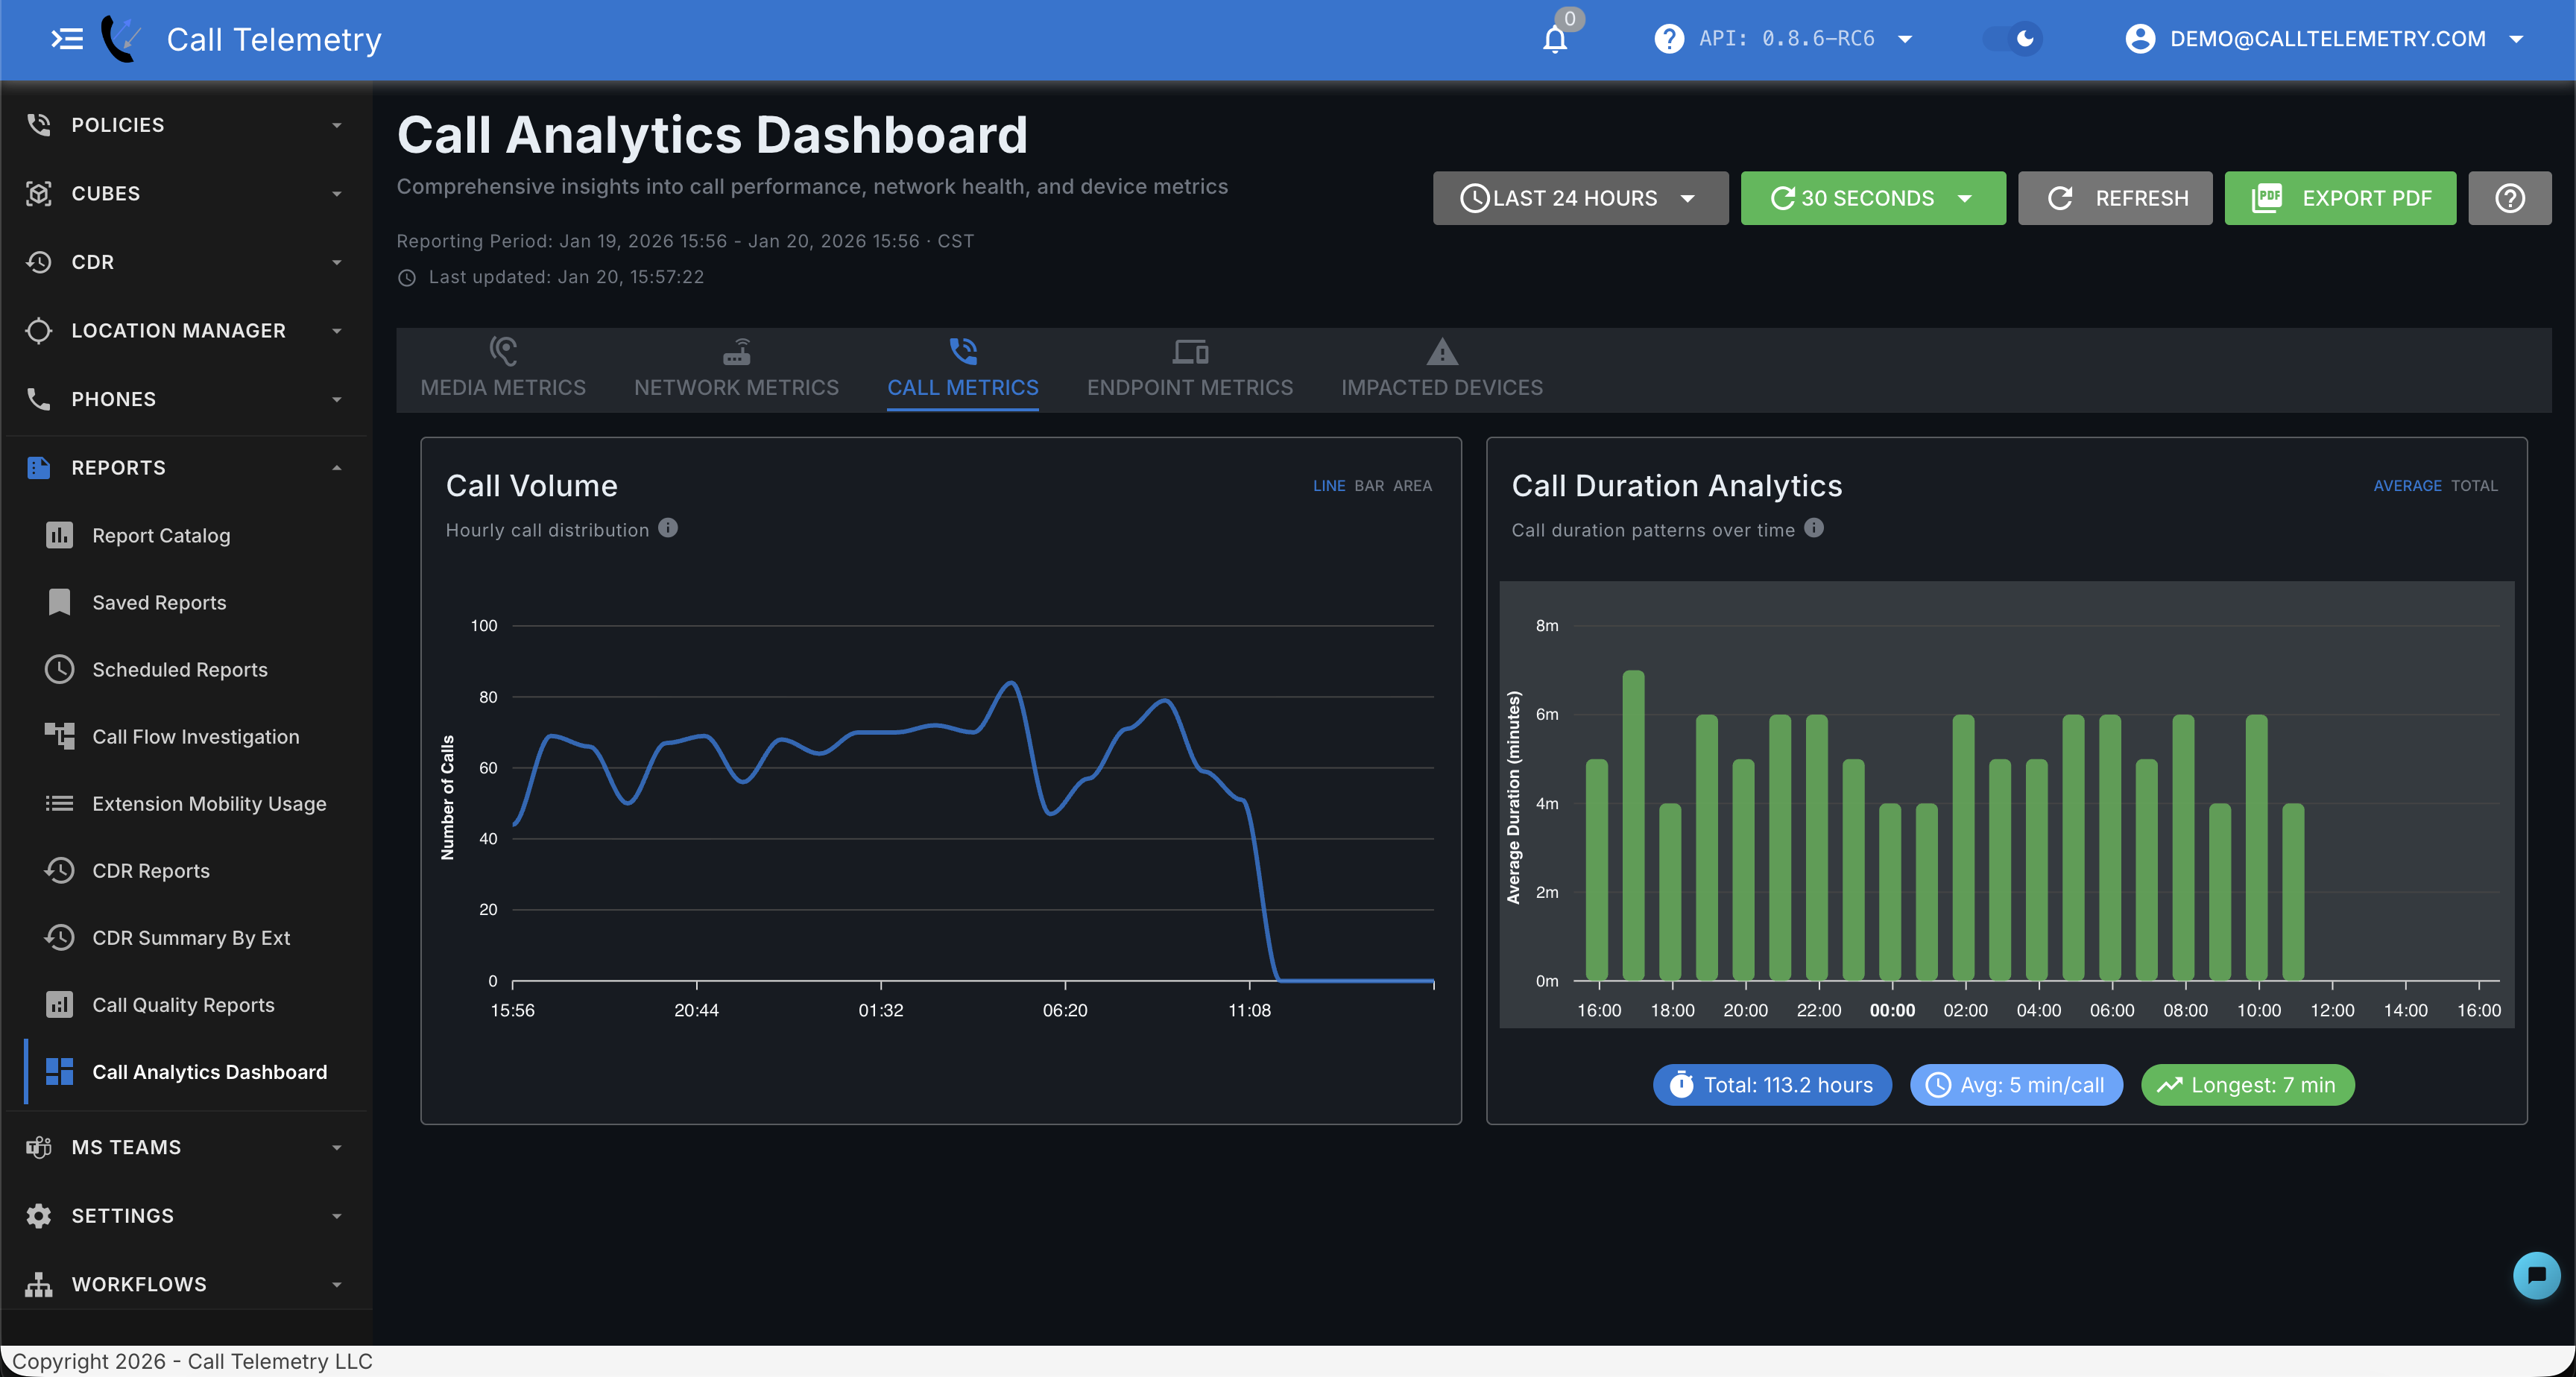
The Call Metrics tab provides call volume and duration insights:
Call Volume
Displays hourly call distribution as a bar chart. Toggle between Line, Bar, and Area views. Use this to identify peak calling hours and capacity planning.
Call Duration Analytics
Shows call duration patterns over time with summary statistics:
- Total Hours: Cumulative talk time for the period
- Average Duration: Mean call length
- Longest Call: Maximum call duration recorded
Toggle between Average and Total views to analyze patterns differently.
Endpoint Metrics Tab
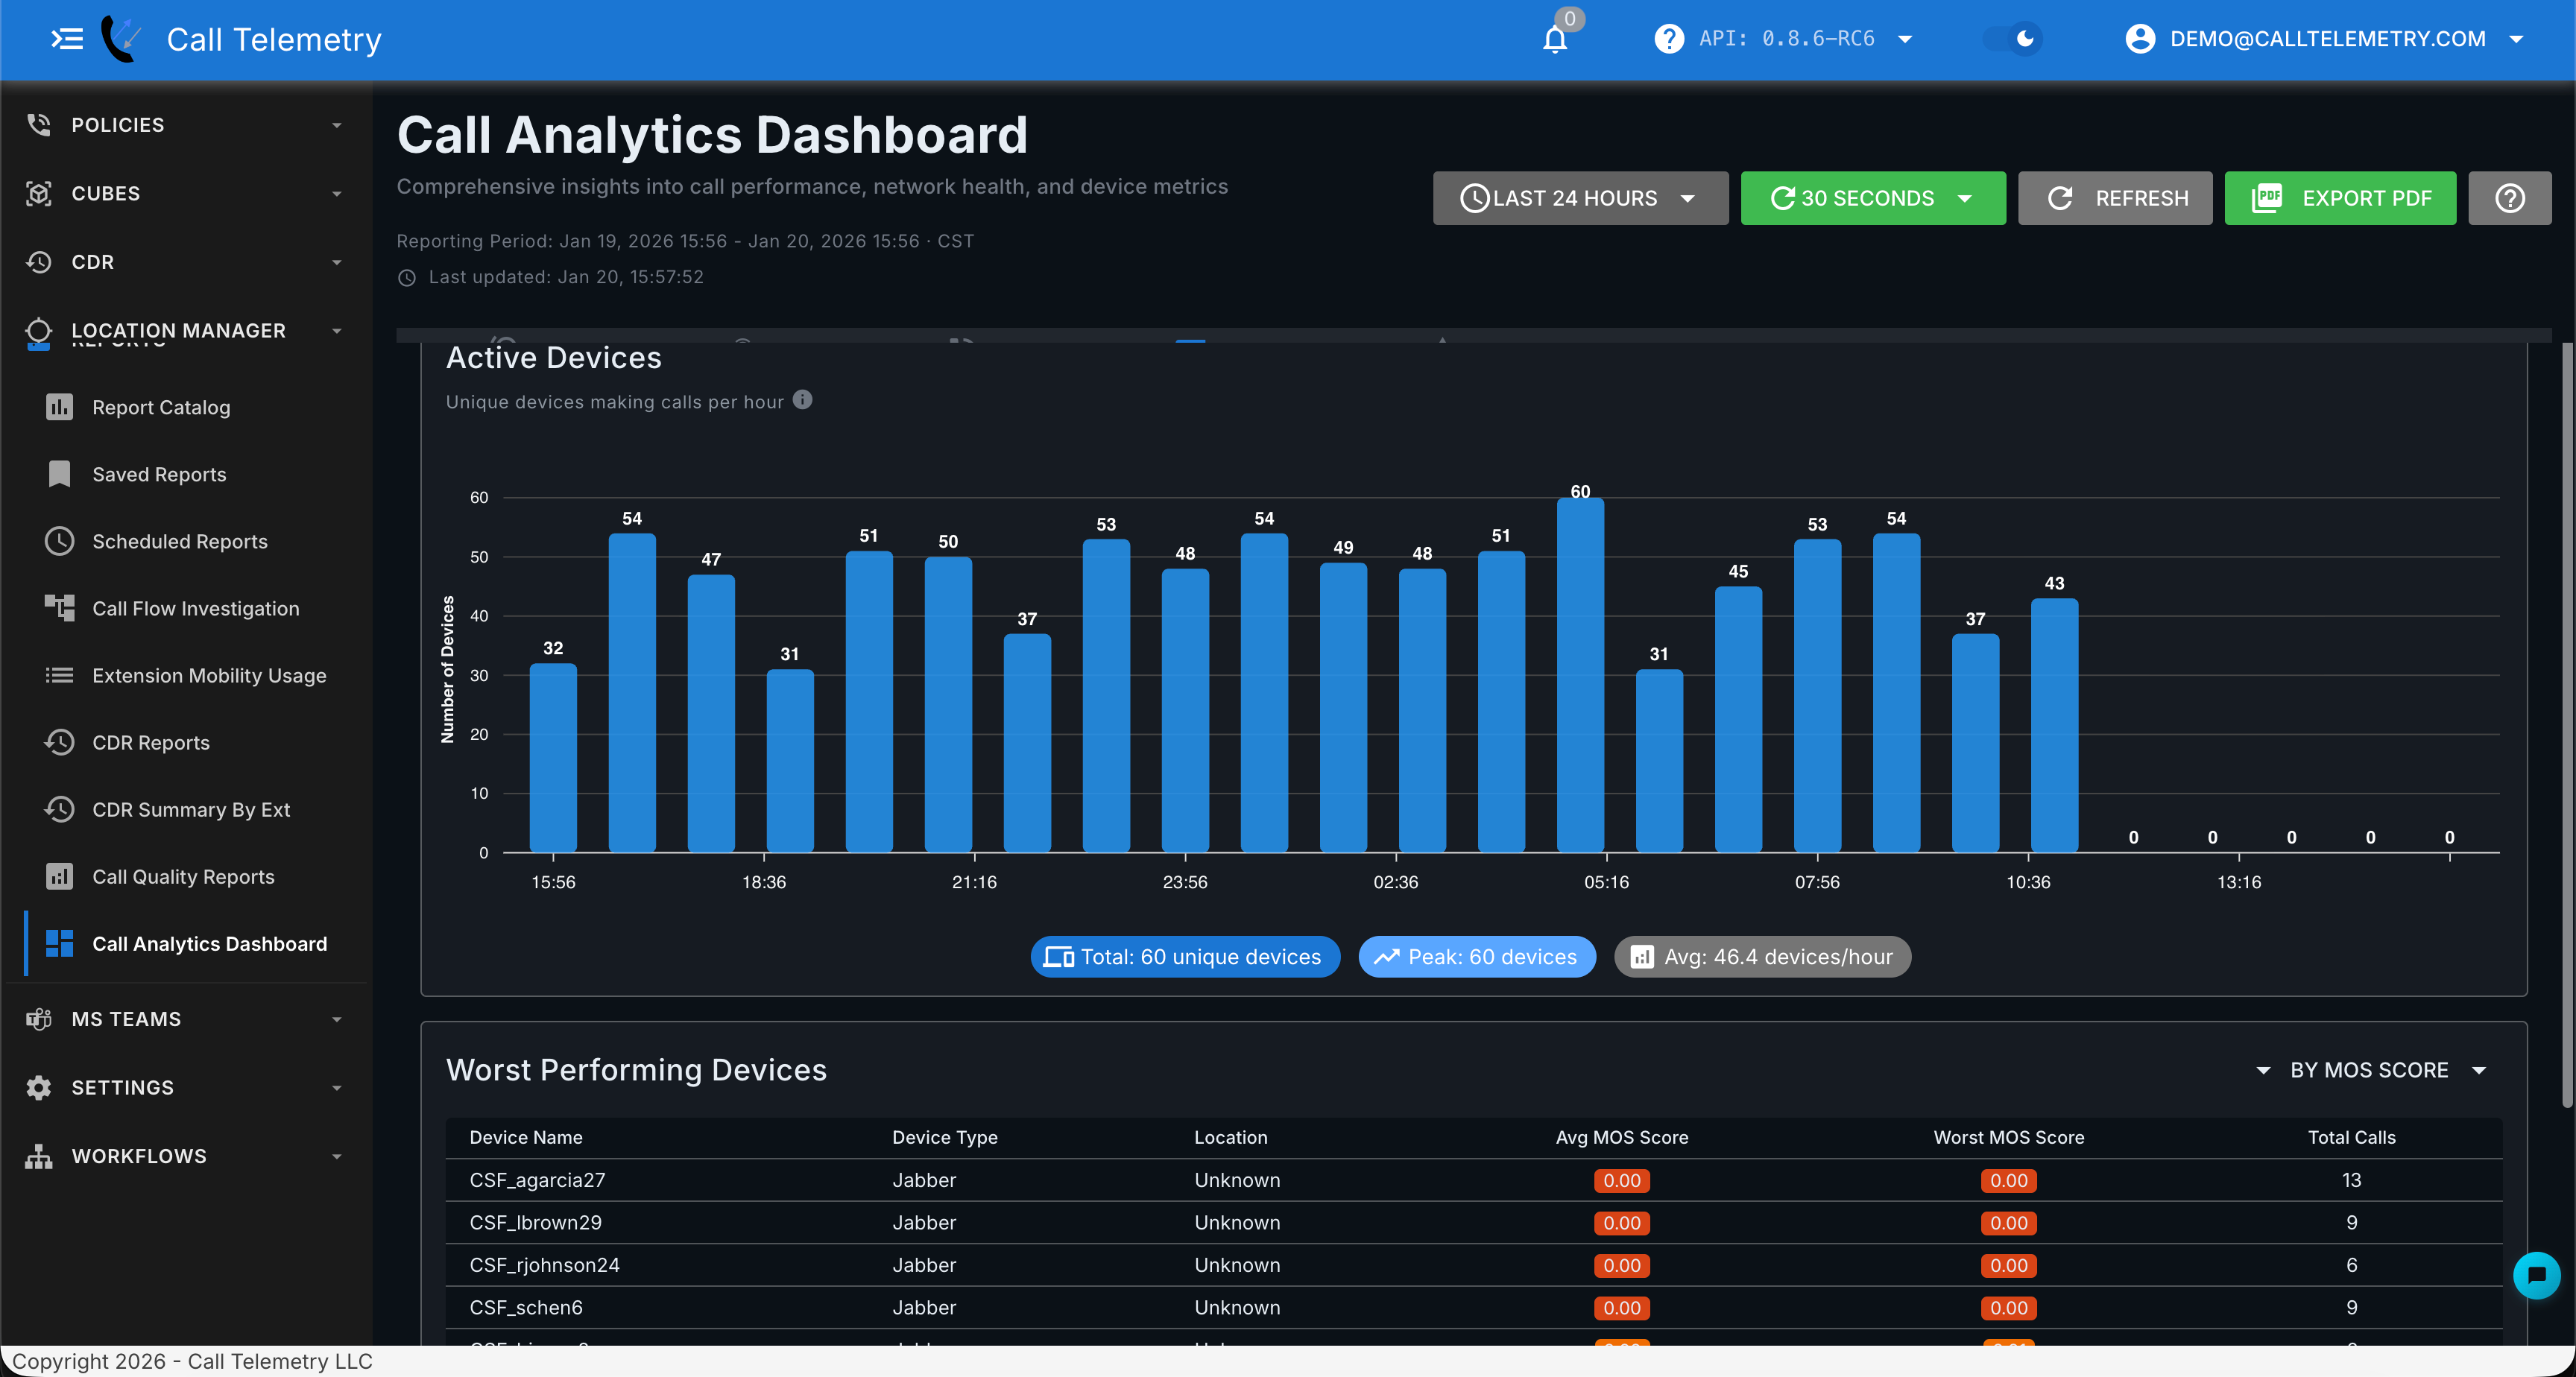
The Endpoint Metrics tab focuses on device-level analysis:
Active Devices
Bar chart showing unique devices making calls per hour, with summary stats:
- Total Unique Devices: Count of distinct endpoints
- Peak Devices: Maximum concurrent devices in an hour
- Average Devices/Hour: Typical device activity level
Worst Performing Devices
Table listing devices with the poorest call quality, sortable by MOS score:
| Column | Description |
|---|---|
| Device Name | Endpoint identifier (SEP MAC, CSF username) |
| Device Type | Phone model or client type (Jabber, IP Phone) |
| Location | Device location if available |
| Avg MOS Score | Average voice quality score |
| Worst MOS Score | Lowest recorded quality |
| Total Calls | Number of calls from this device |
Click any device row to investigate its call quality records.
Impacted Devices Tab
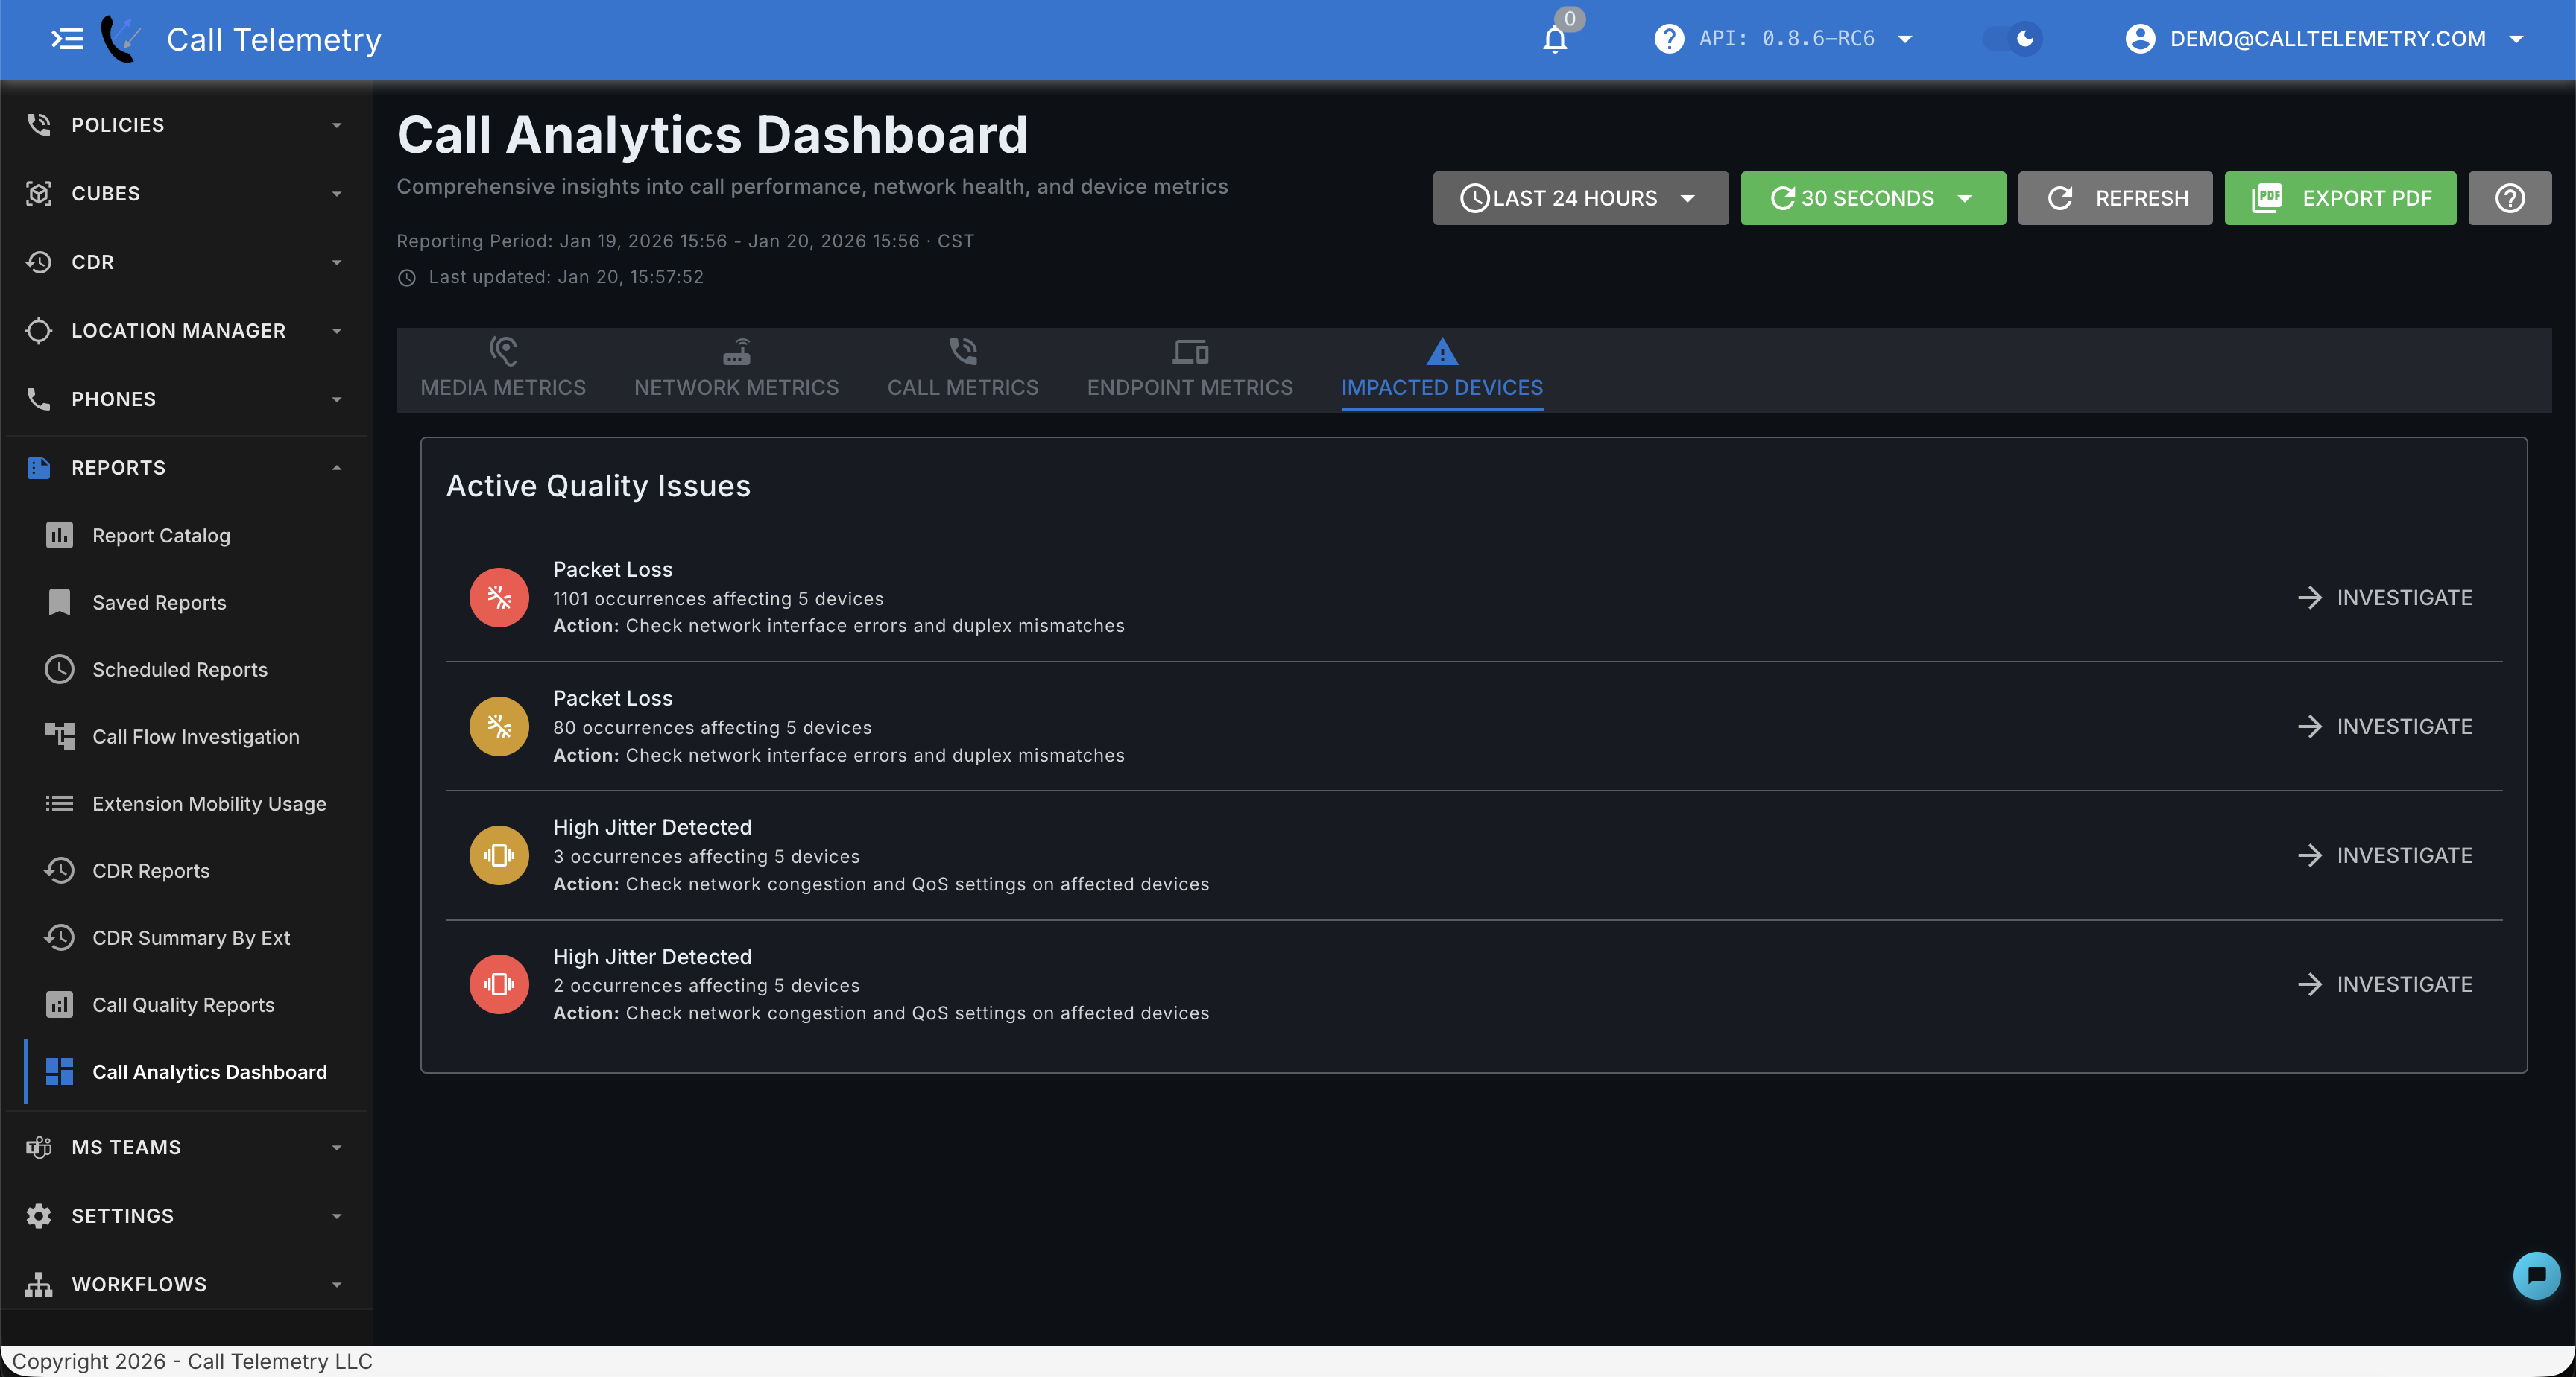
The Impacted Devices tab aggregates quality issues into actionable alerts:
Active Quality Issues
Lists current quality problems with recommended actions:
| Issue Type | Description | Recommended Action |
|---|---|---|
| Packet Loss | Dropped packets affecting audio | Check network interface errors and duplex mismatches |
| High Jitter | Inconsistent packet timing | Check network congestion and QoS settings |
| High Latency | Audio delay issues | Review network path and routing |
Each issue shows:
- Occurrence count — How many times detected
- Affected devices — Number of endpoints impacted
- Investigate button — Links to filtered CMR records for the affected devices
Call Quality Reports
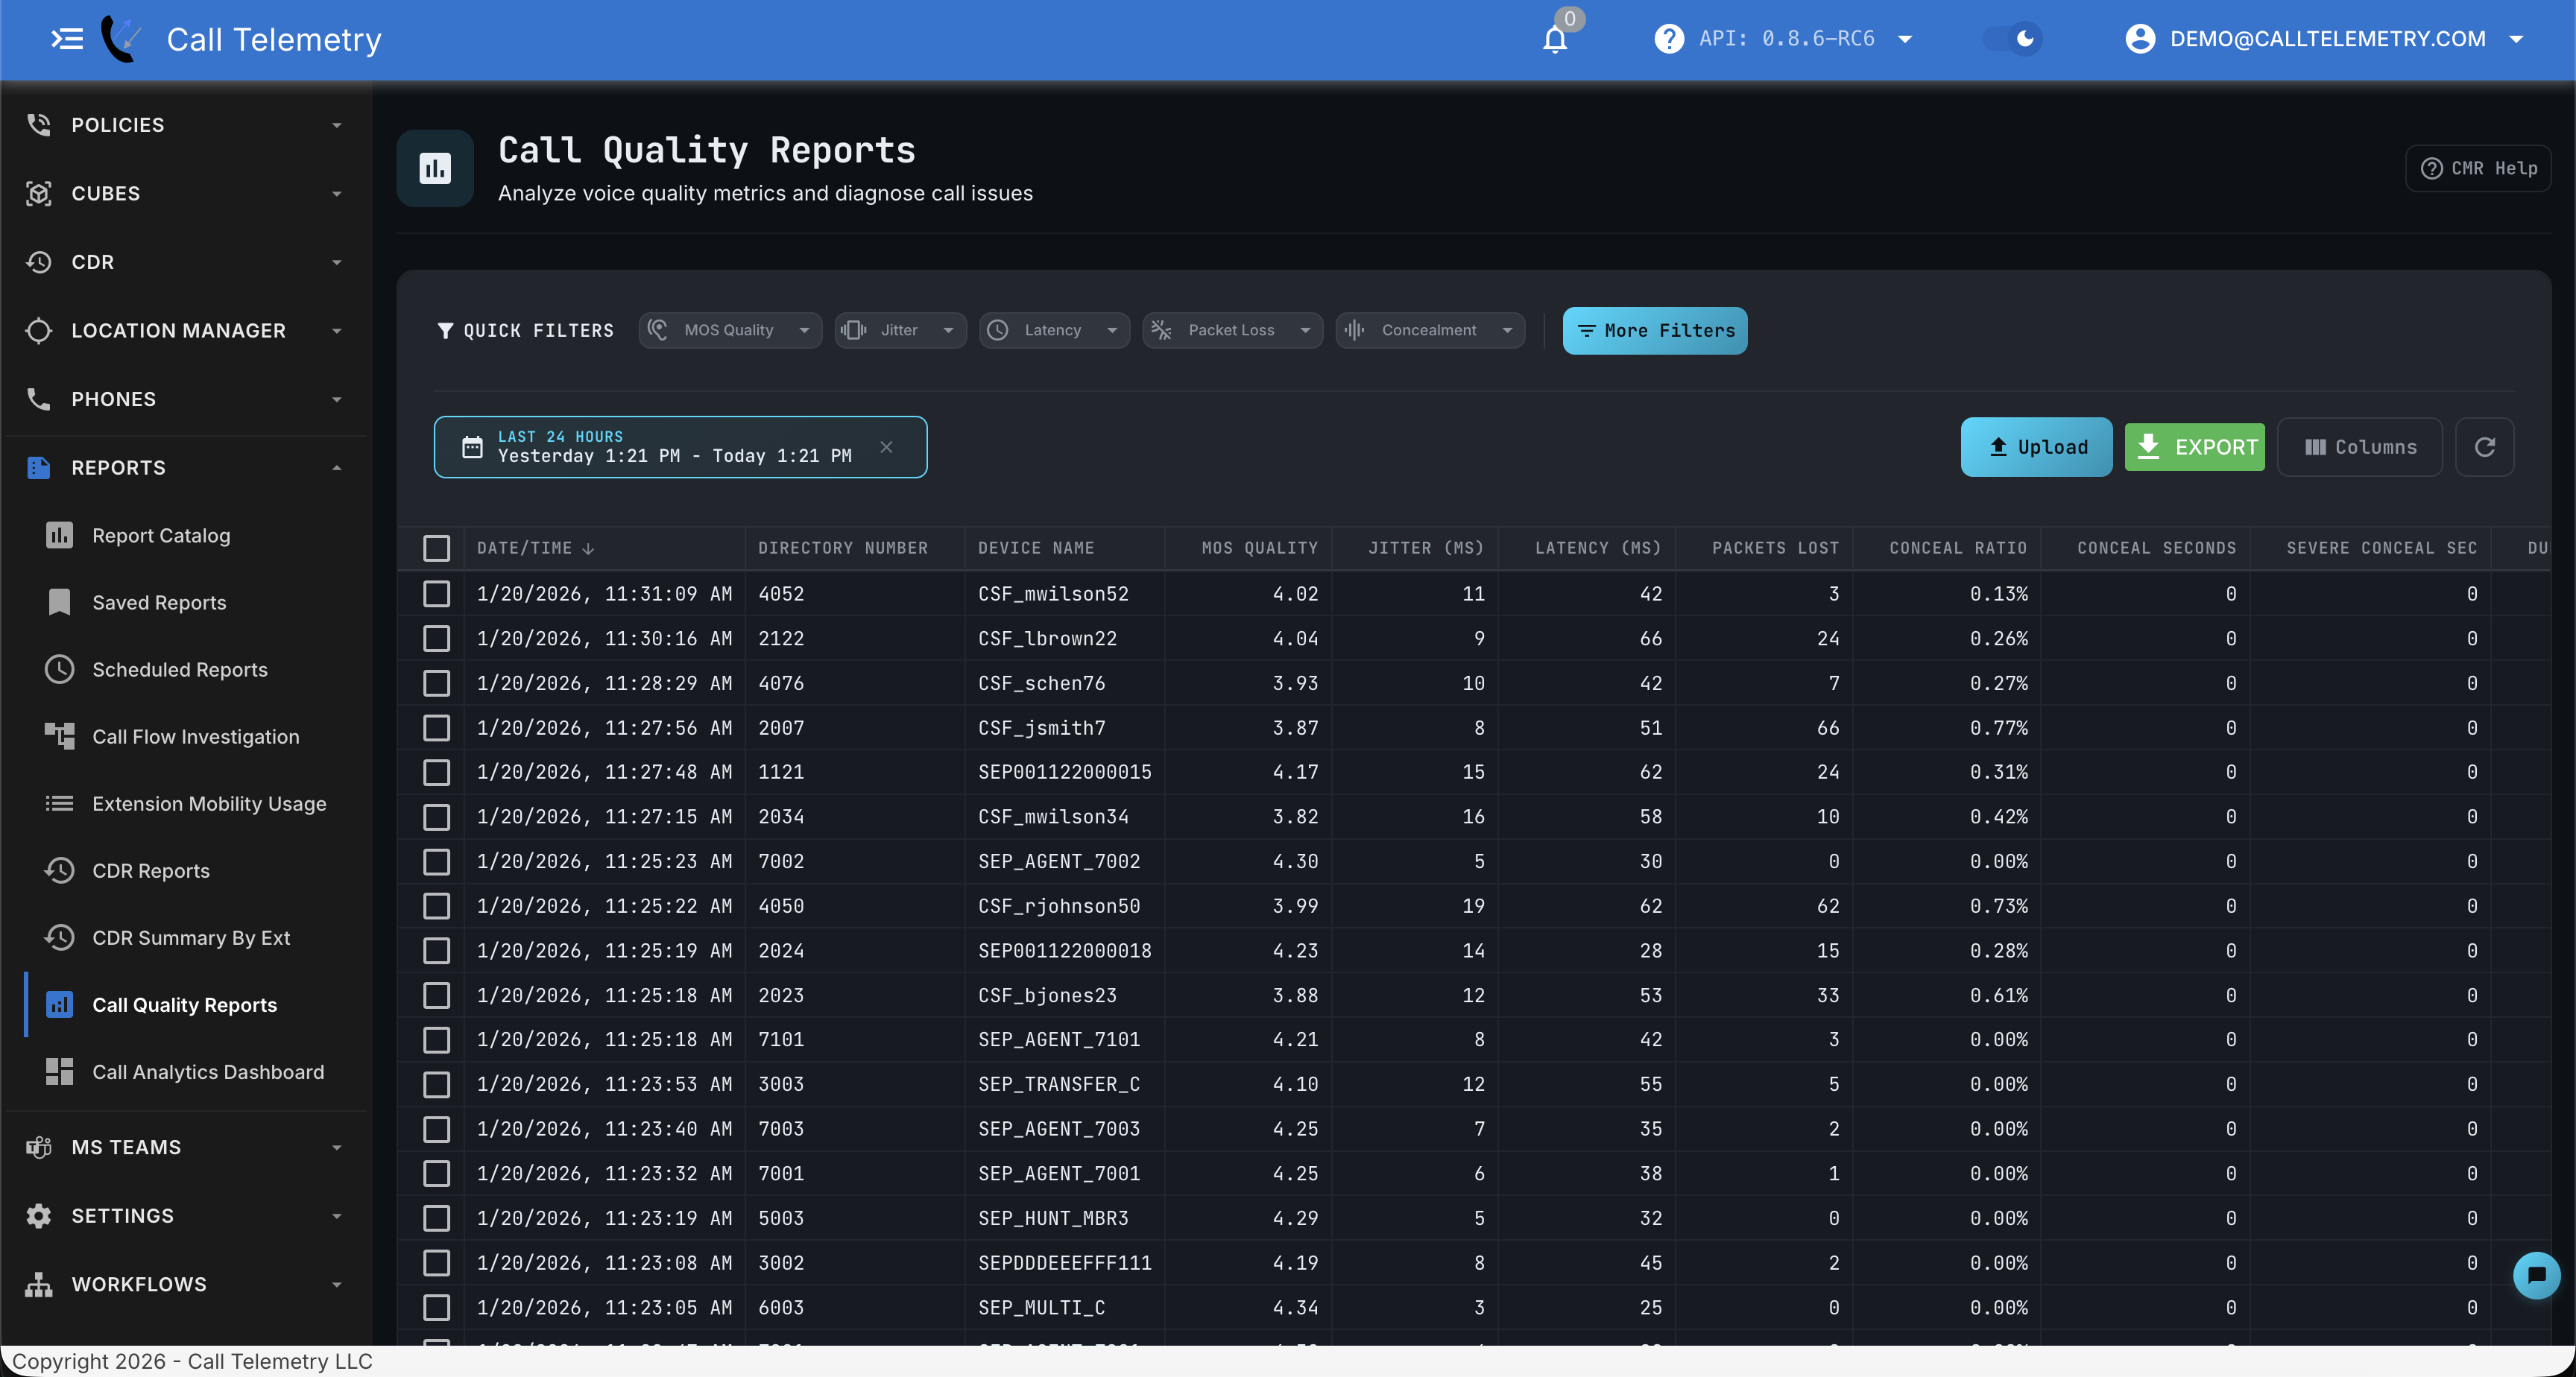
The Call Quality Reports page provides a comprehensive interface to analyze voice quality metrics and diagnose call issues. Key features include:
- Quick Filters: One-click filters for common quality issues (WiFi Quality, All, Latency, High Jitter, Packet Loss)
- Date Range Picker: Select custom time ranges or use preset options to focus your analysis
- Advanced Filtering: Click + More Filters to build complex filter criteria by combining multiple conditions
- Export: Download report data to CSV for external analysis or sharing
- Column Customization: Show or hide columns to focus on the metrics that matter most
Report Table Columns
| Column | Description |
|---|---|
| Date/Time | Timestamp when the call occurred |
| Directory Number | Phone number or extension involved in the call |
| Device Name | Endpoint identifier (e.g., CSF_username for Jabber, SEP for hard phones) |
| MOS Quality | Mean Opinion Score (1-5 scale) |
| Jitter [AVG] | Average packet arrival variation in milliseconds |
| Latency | One-way audio delay in milliseconds |
| Pkt Lost/Sent | Packets lost and total packets sent during the call |
| Codec | Audio codec used (G.711, G.722, Opus, etc.) |
| Conceal Ratio/Seconds | Concealment metrics showing how much audio was interpolated |
| Duration | Total call length |
| Source/Dest | Source and destination endpoints for the call leg |
Navigating Call Quality Records
Date Range Selection
By default, the page loads the last 24 hours of call quality data. It includes the following quick charts at the top of the page:
- Average MOS Score
- Call Quality Distribution
- Network Metrics (Jitter, Latency, Packet Loss)
- Audit Quality Issues and concelment chart.
Use the conditions date picker to select custom ranges
Quality Filters
You'll notice the quick filters for easy identification of problematic call events. They apply a couple simple filters:
- Poor MOS
- High Jitter
- High Latency
- Packet Loss
You can also build your own filter by quality thresholds using the following filters:
- MOS Score ranges
- Jitter thresholds
- Latency limits
- Concealment percentages
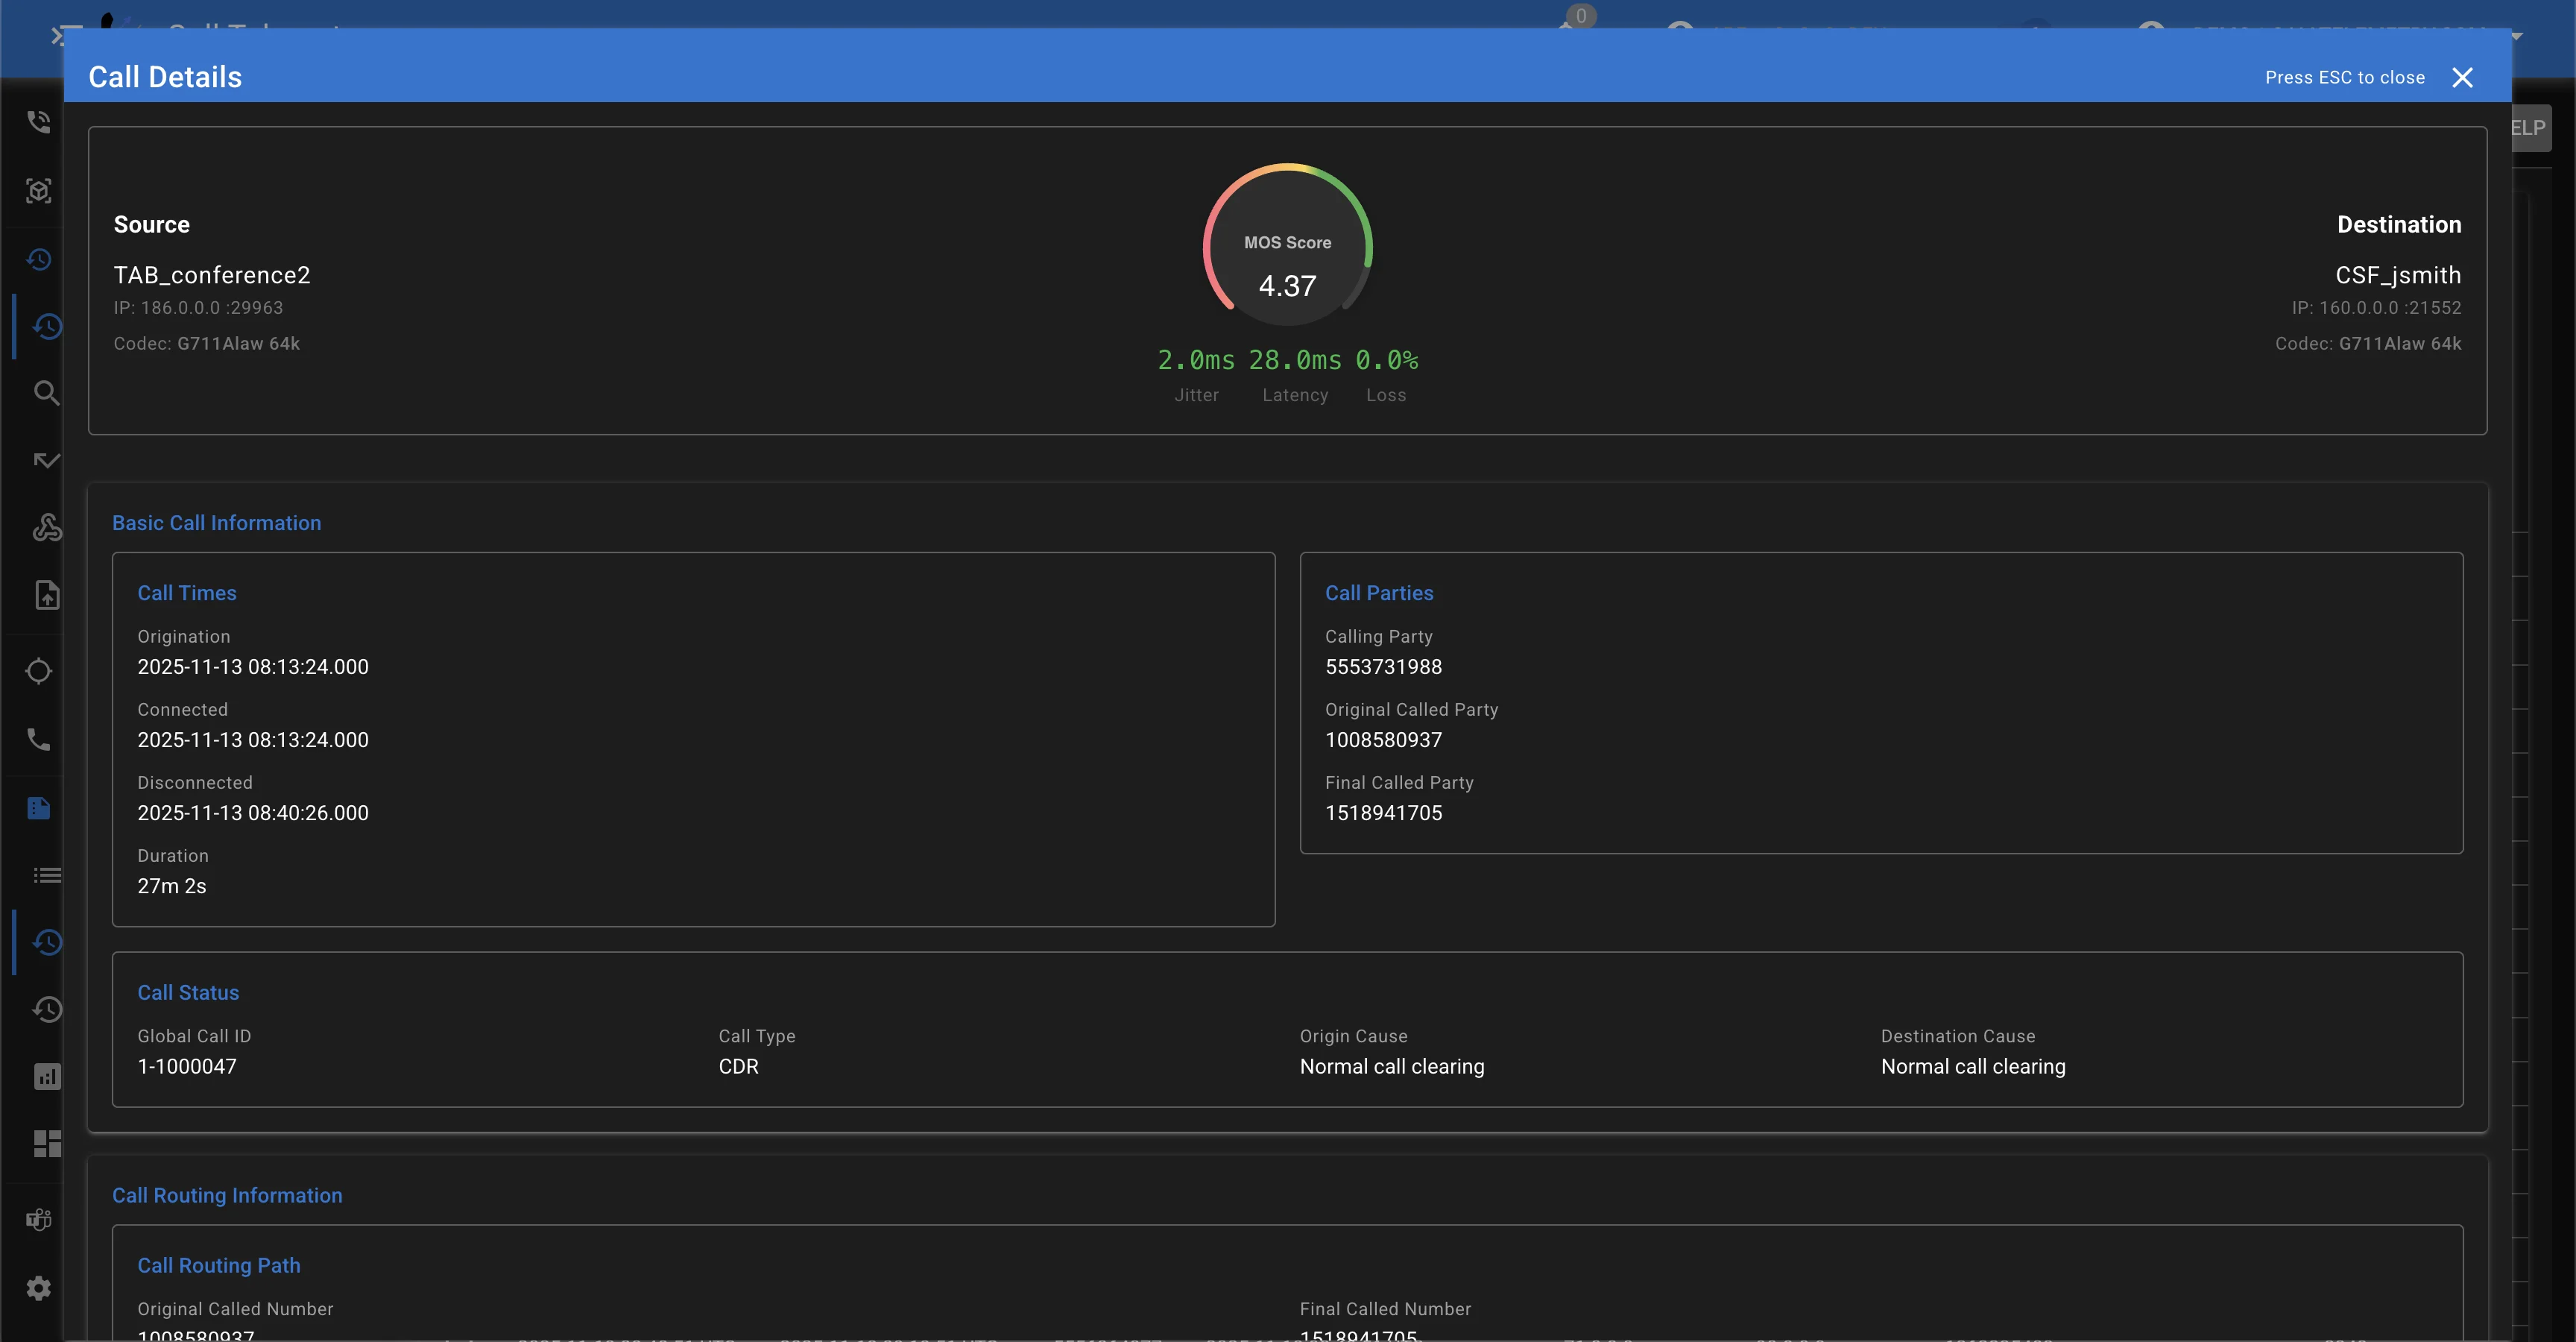
Call Quality Detail per Call Record
Click on any row in the table to view detailed call quality metrics for that specific call. The detailed view drills down into the call and endpoint details.
On the Meric Detail page you can see the follow details for the call:
- Call Record Details
- Jitter, Latency and Lost Packets
- Average MOS score, min and max MOS Scores
- Audio Concealment stats
- Packets Sent / Received and Lost
Next Steps
- CDR Reporting — Use raw CDR records to investigate the "what" alongside the quality "how"
- Reporting Overview — Aggregated call volume and accounting analytics
- Call Flow Investigation — Trace call legs through transfers and hunt groups
- CUBE Analytics — Real-time gateway quality and capacity monitoring