Cisco CDR Report Builder
The Report Builder is where you configure and run custom CDR reports. This guide covers every option—from selecting a template to exporting results.
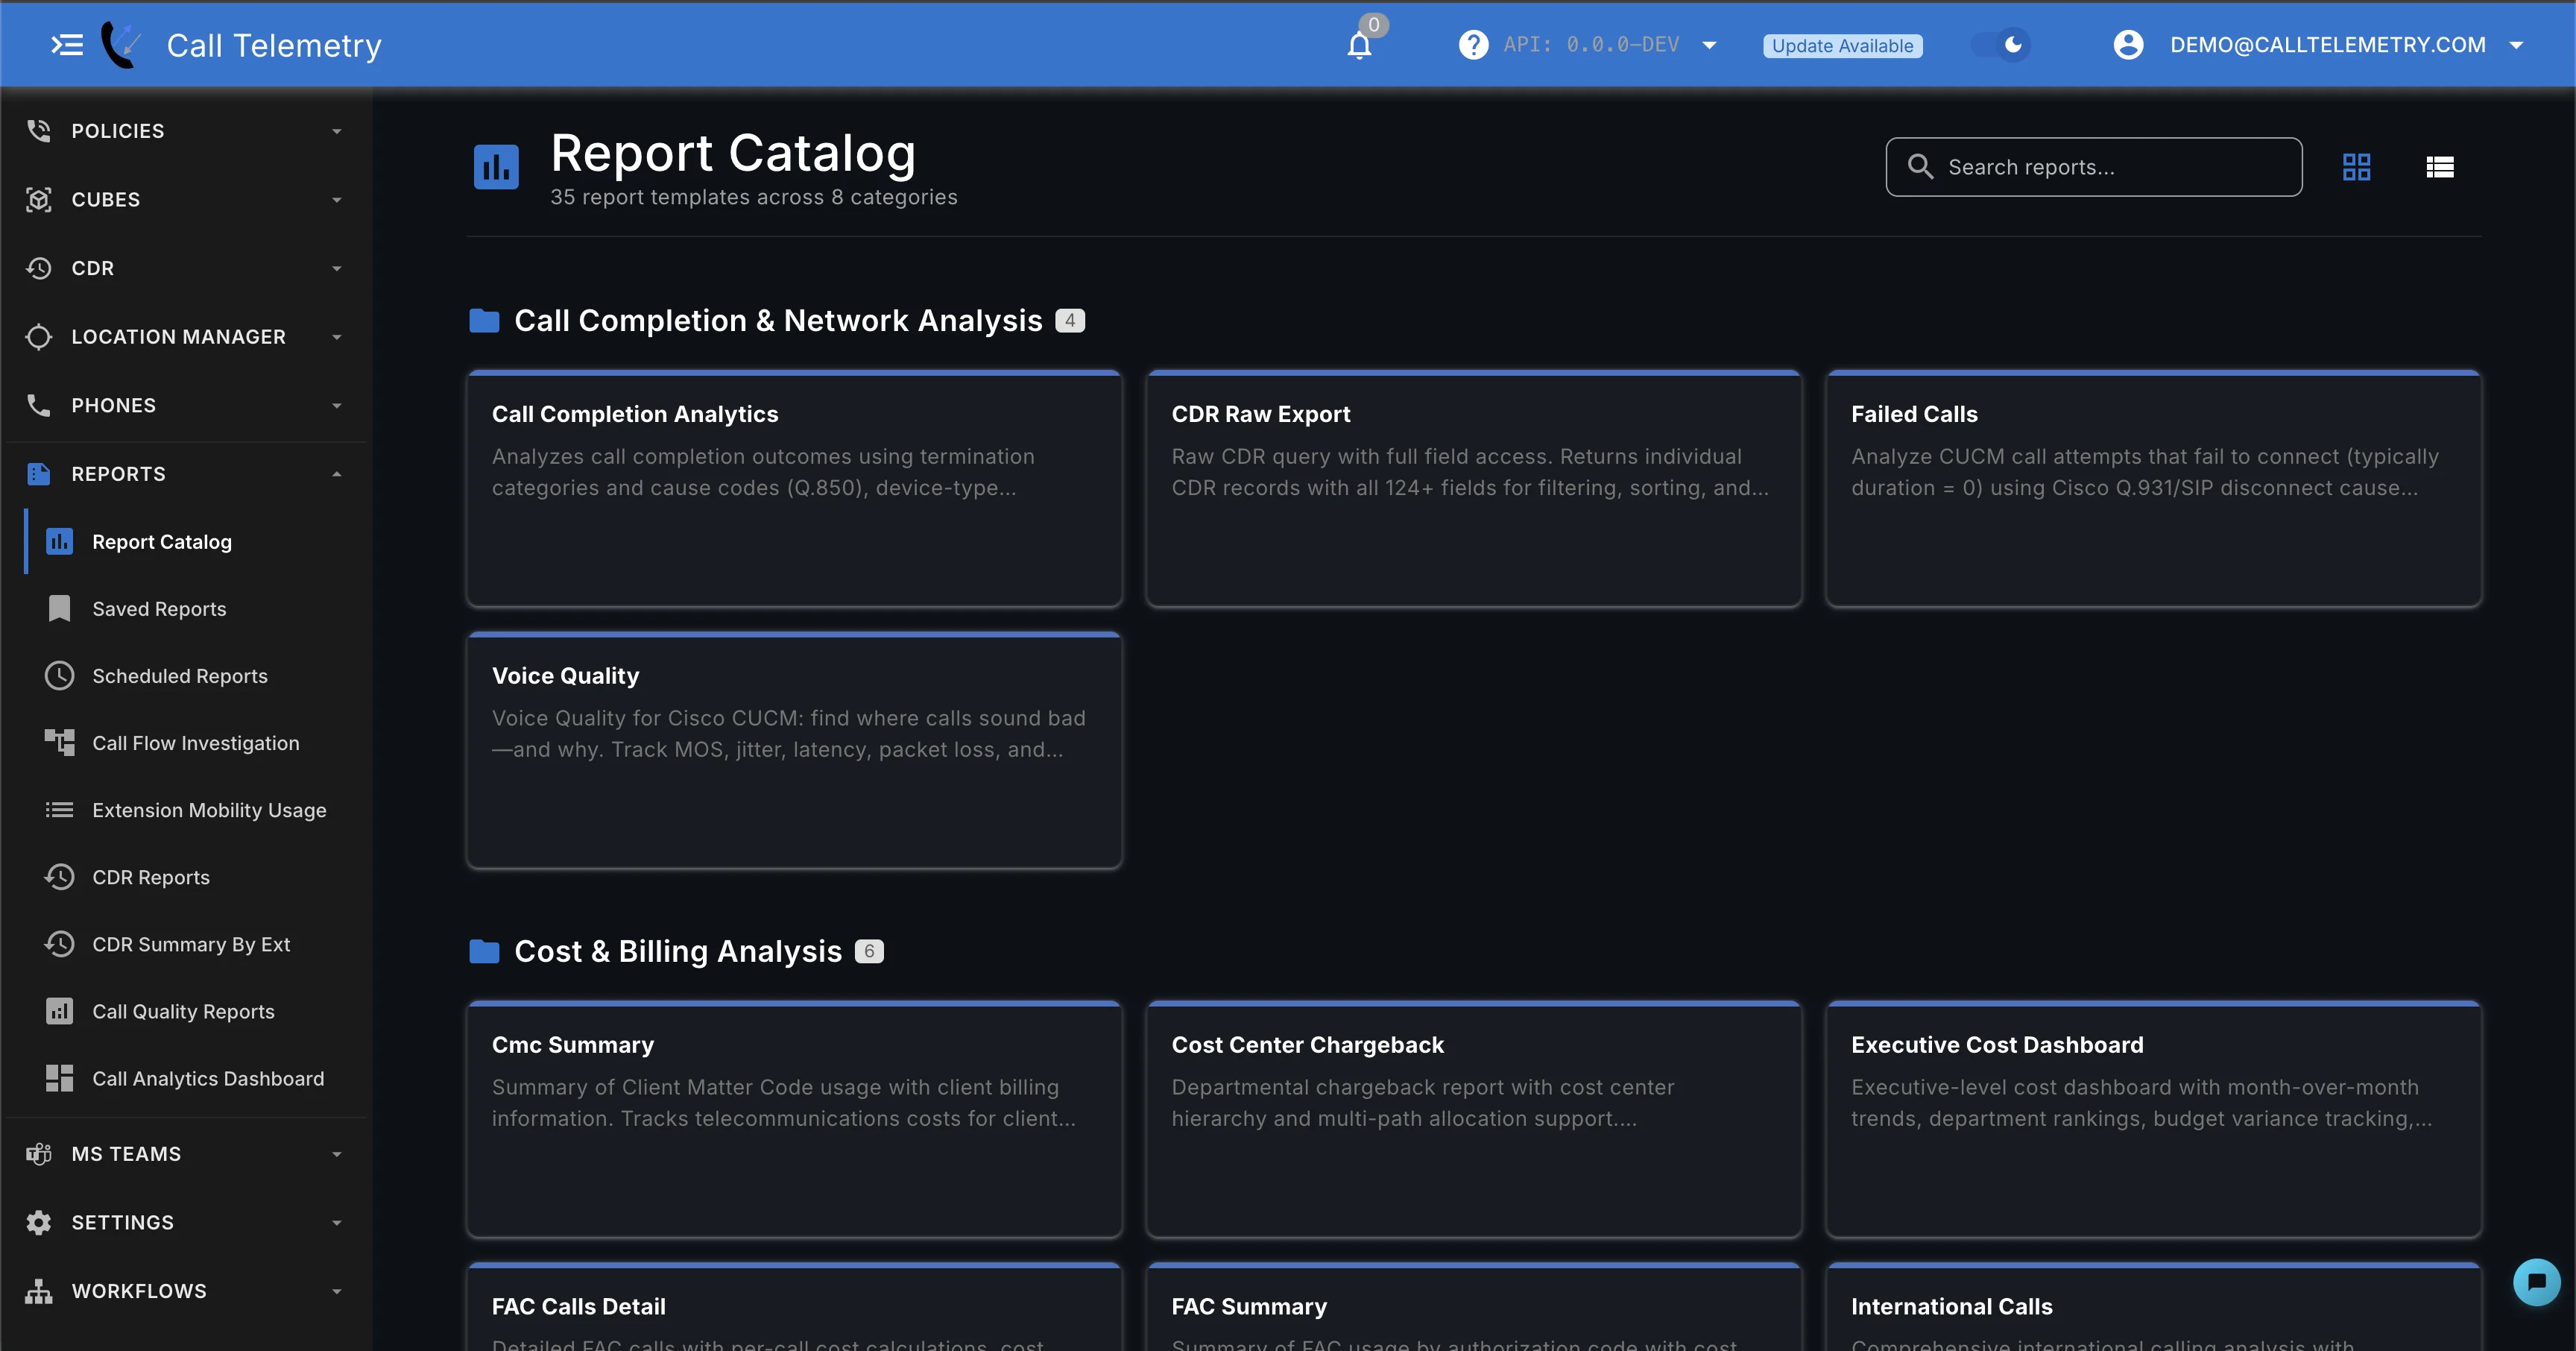
Step 1 — Open the Report Catalog and pick a template
- Navigate to Reports → Report Catalog
- Browse templates by category or search
- Click a template card to open the Report Builder
Step 2 — Choose a Quick View or build your own report
Quick Views are pre-configured queries that answer common business questions with one click. Not all templates have them—the tab only appears when available.
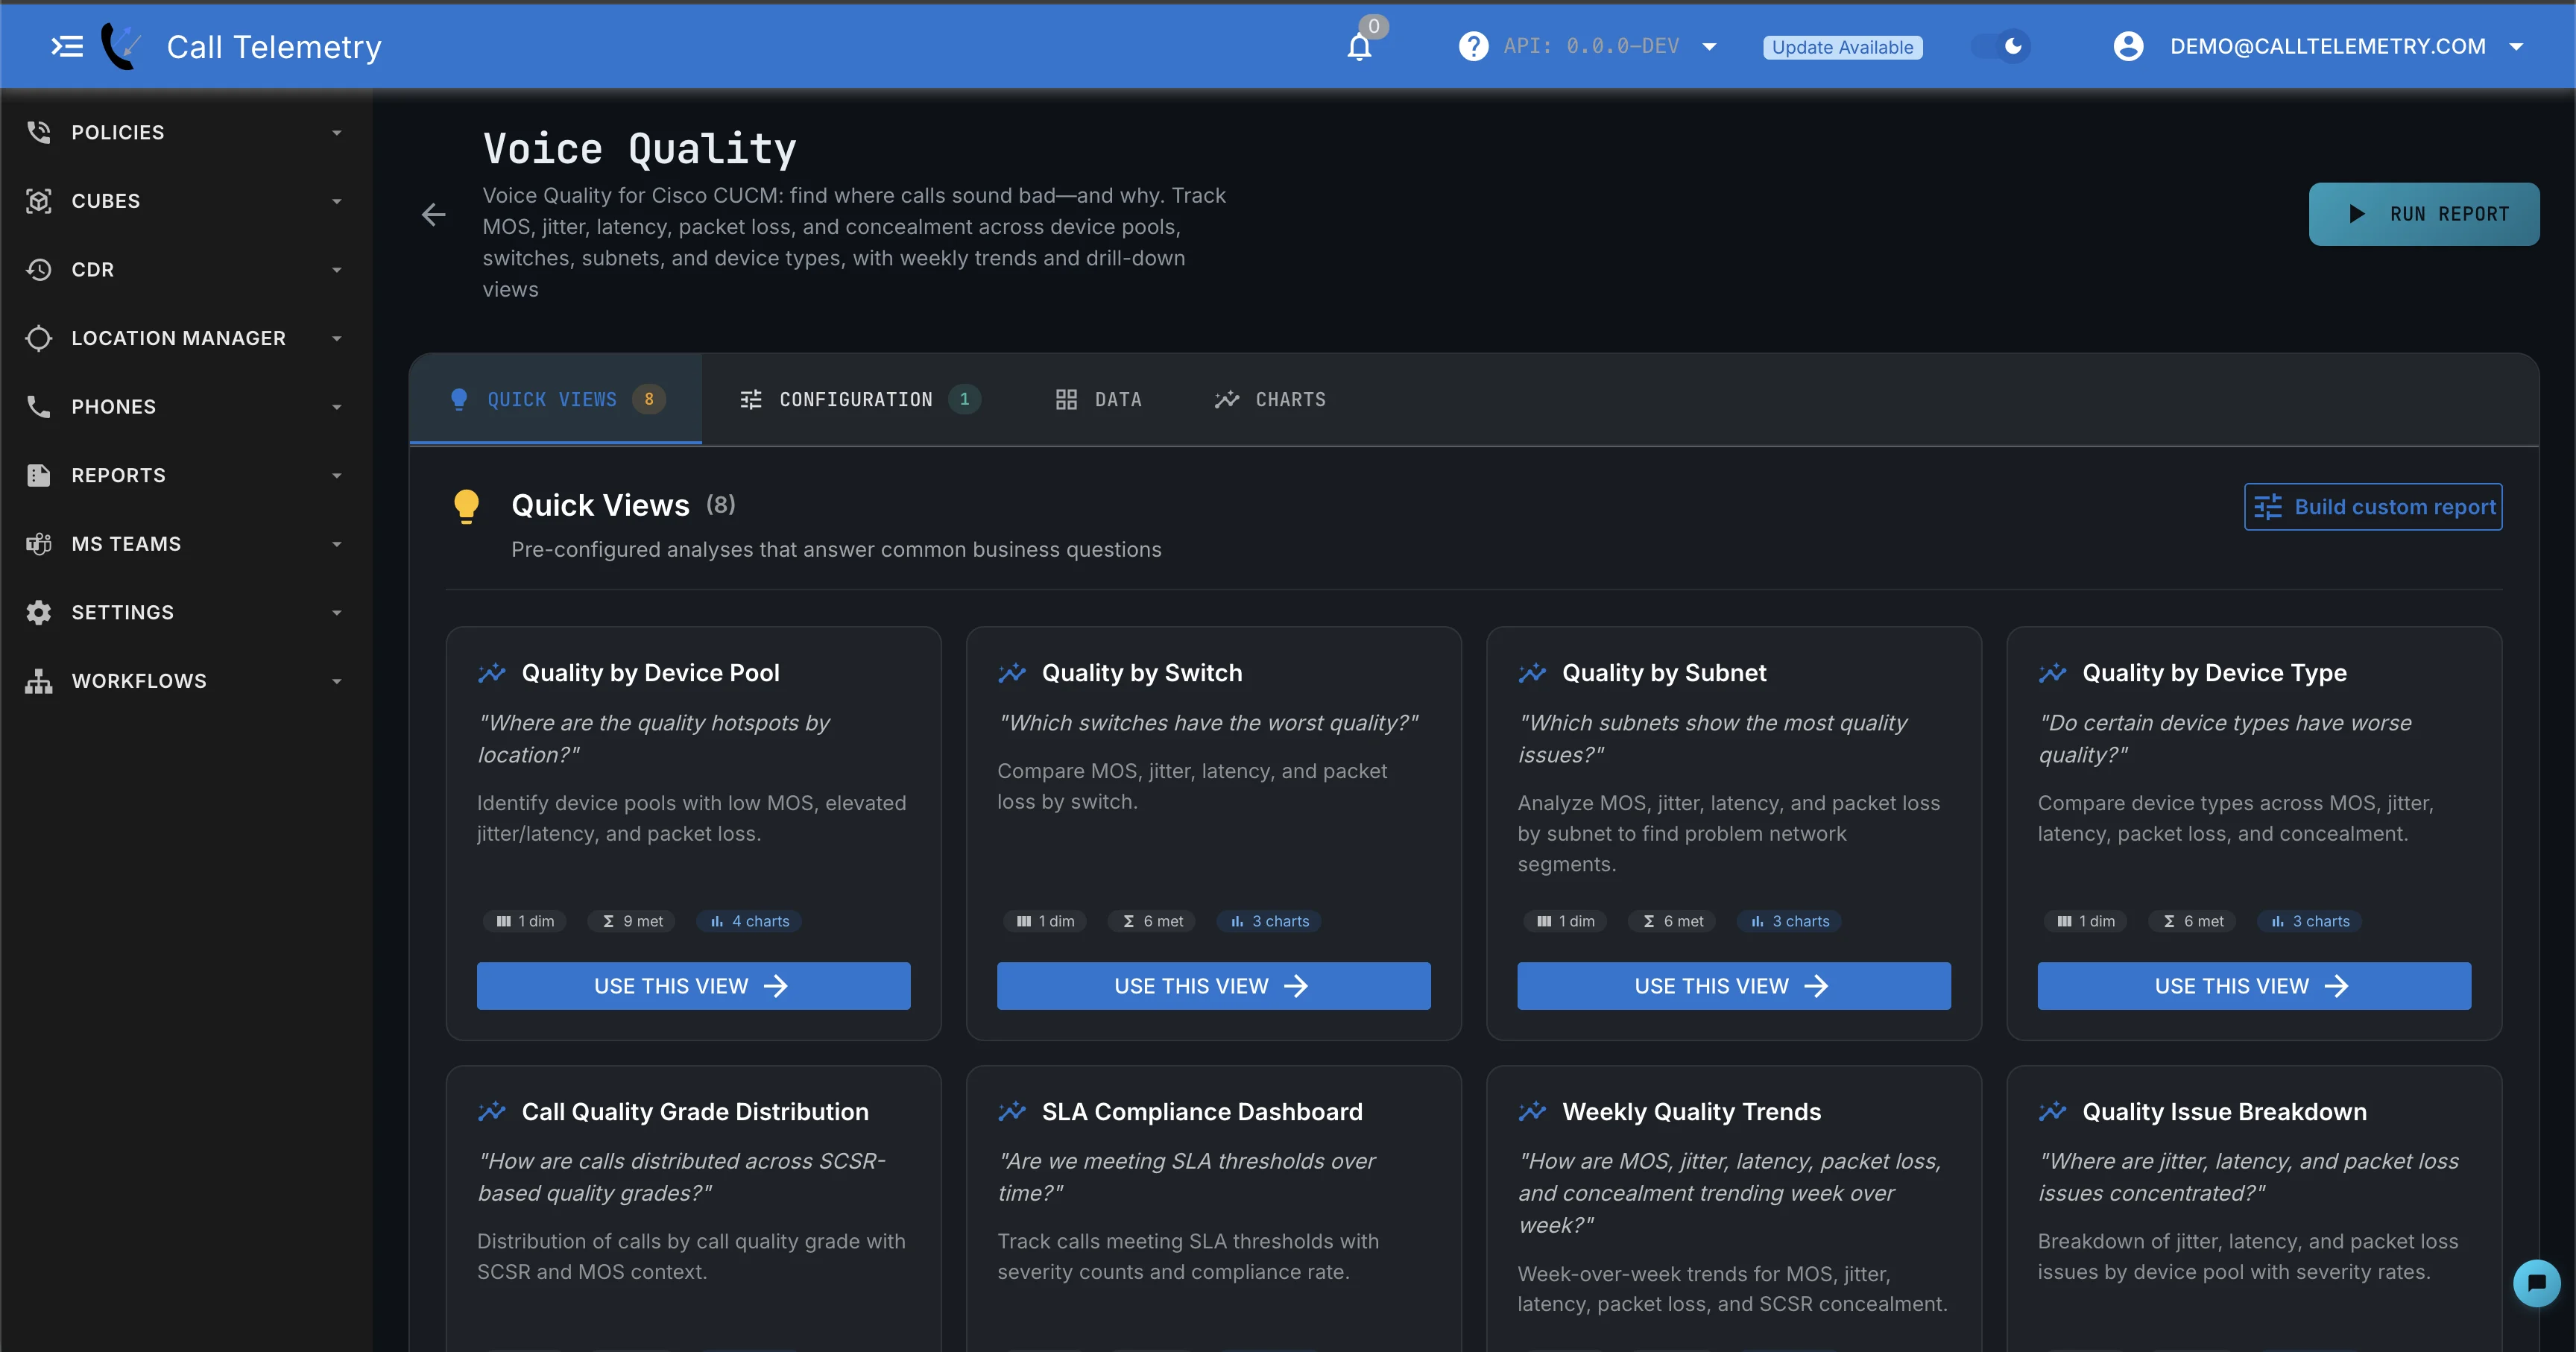
- Click the Quick Views tab
- Select a view (e.g., "Quality by Device Pool")
- Click Run Report
To build from scratch, click Build custom report (or switch to Configuration).
Step 3 — Configure your report
Use Configuration to define what the report groups by, measures, filters out, and how results are ranked.
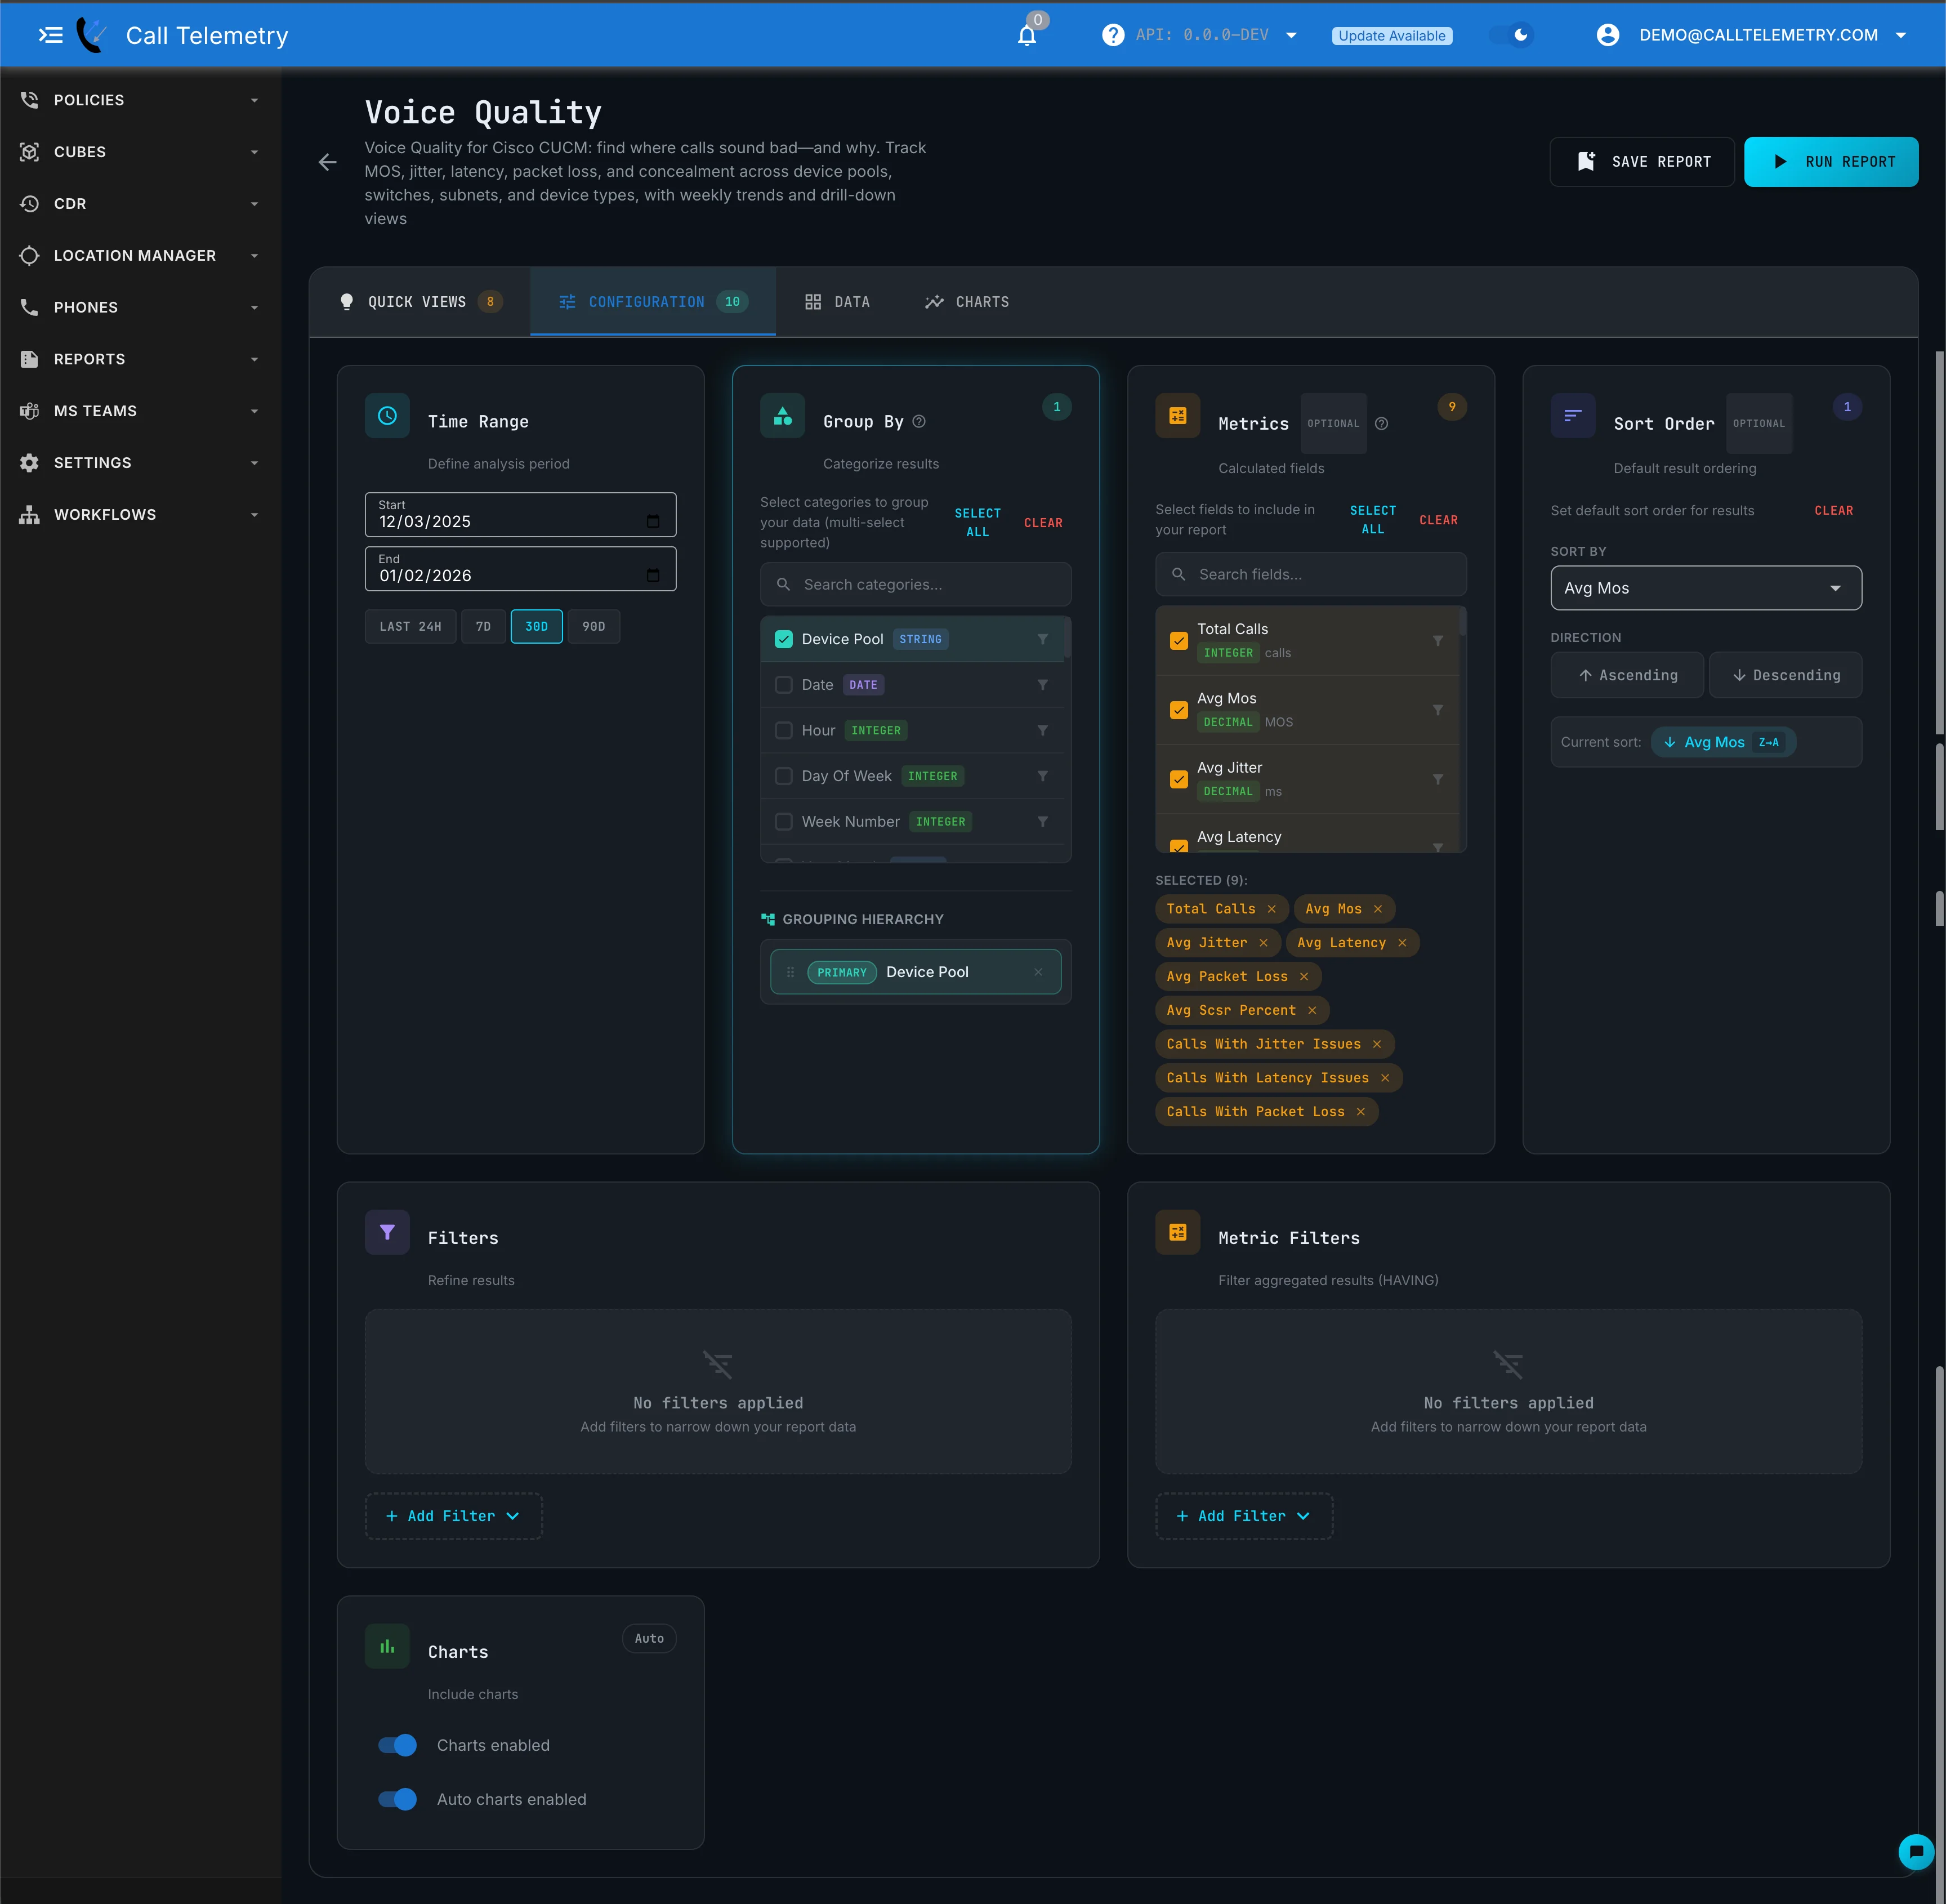
Time Range
Set the date range using presets (Last 24h, 7d, 30d) or custom dates. Community licenses are limited to 7 days of CDR data.
Dimensions (Group By)
Dimensions determine how data is grouped—the "rows" in your report.
| Dimension | Groups Data By |
|---|---|
date | Calendar day |
user_number | Extension number |
department | User department |
device_name | Device name (SEP...) |
cause_code | Q.850 disconnect cause |
Add multiple dimensions and drag to reorder.
Metrics (Measurements)
Metrics are calculated values—the "columns" of numbers.
| Metric | What It Measures |
|---|---|
total_calls | Count of call records |
avg_duration | Average call duration |
success_rate | Percentage completed |
missed_calls | Unanswered calls |
total_cost | Cost from costing rules |
Filters
Filters limit which records are included (SQL WHERE clause).
| Operator | Example |
|---|---|
equals | department = "Sales" |
contains | device_name contains "SEP" |
in list | cause_code in [17, 18, 19] |
between | duration between 0 and 10 |
Multiple filters combine with AND logic.
Metric Filters (HAVING)
Filter on aggregated values after grouping.
Example: Show only departments with more than 50 missed calls.
Advanced Filters
Access 125+ raw CDR/CMR fields beyond template dimensions:
c.prefix = CDR fields (callingPartyNumber, destDeviceName)cmr.prefix = CMR quality fields (mos_listening_quality, jitter)
Step 4 — Run and review results
Click Run Report. Results appear in the Data tab.
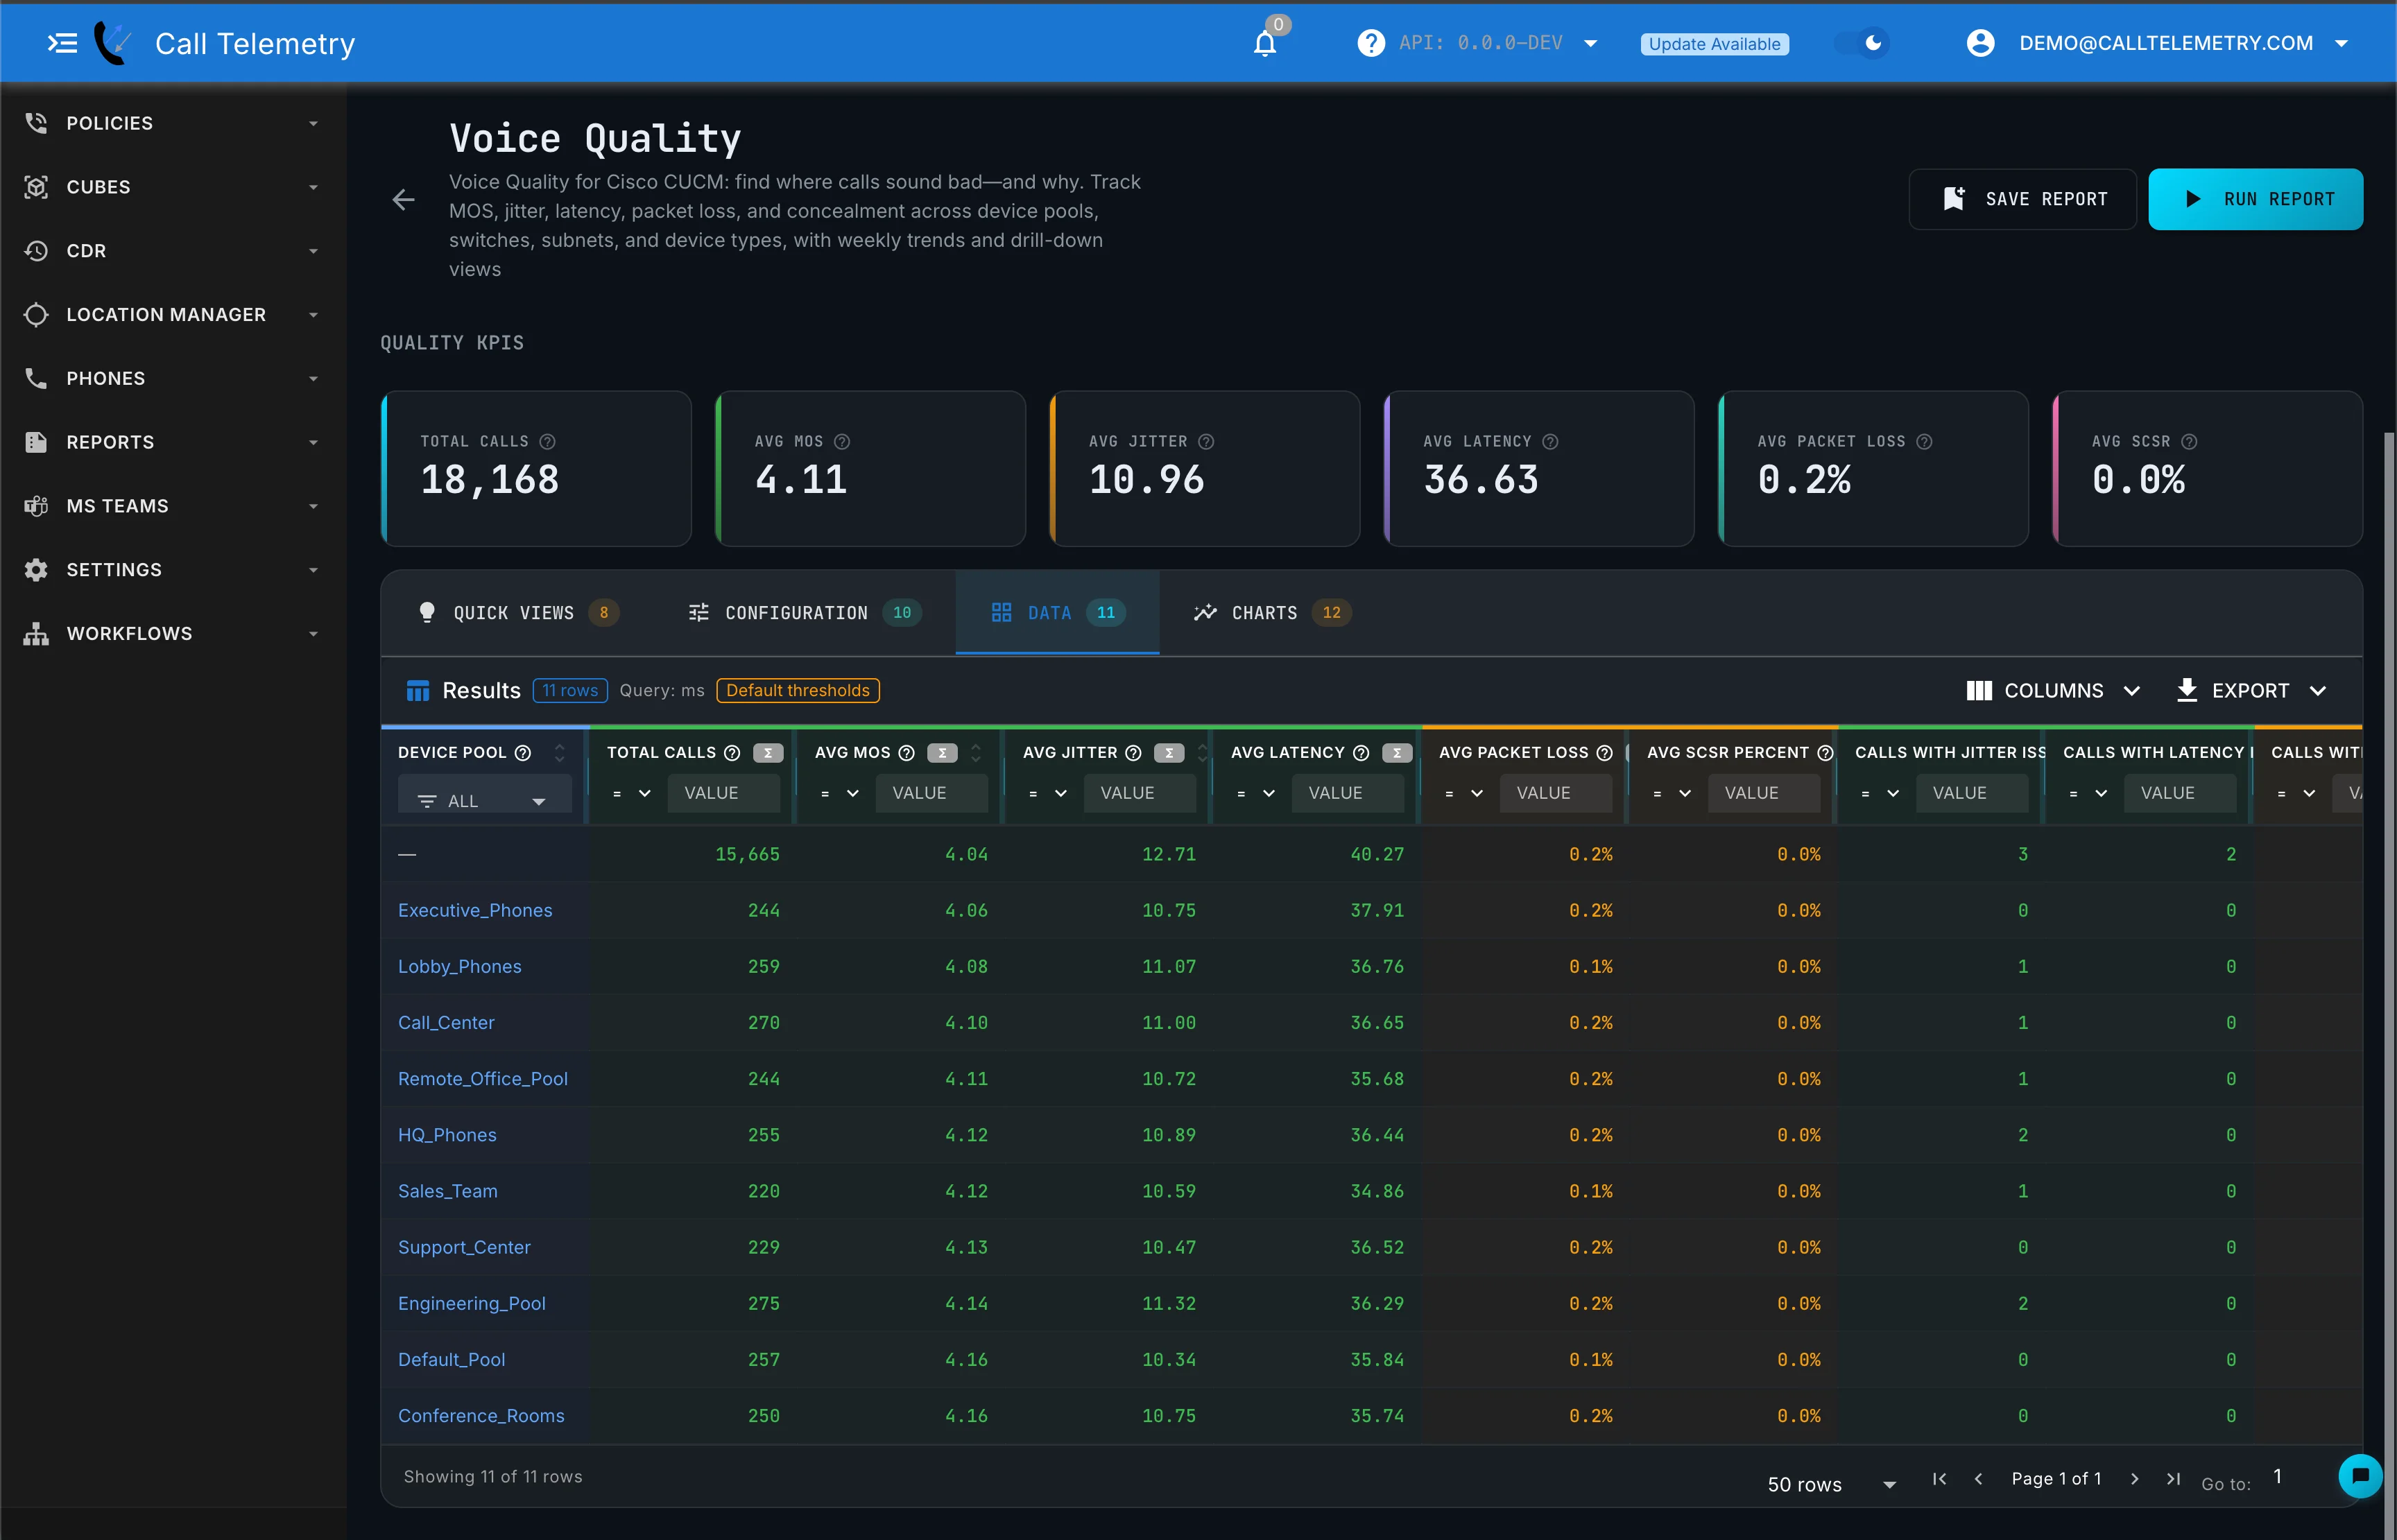
Table Features
| Feature | Description |
|---|---|
| Column Filtering | Filter each column inline—multi-select checkboxes for dimensions, numeric operators (equals, greater than, less than, between) for metrics |
| Column Sorting | Click any header to sort ascending/descending |
| Column Visibility | Show/hide columns via the Columns dropdown; use "All" or "None" for batch control |
| Column Resizing | Drag column borders to resize |
| Pagination | Navigate pages with configurable page size (25, 50, 100, 250, or All) |
| Value Formatting | Duration, currency, percentages, and dates display in human-readable format |
Exporting
Click Export and choose CSV or XLSX.
Charts
The Charts tab visualizes your report data. Auto-generated charts are created based on your query's data types and template domain.
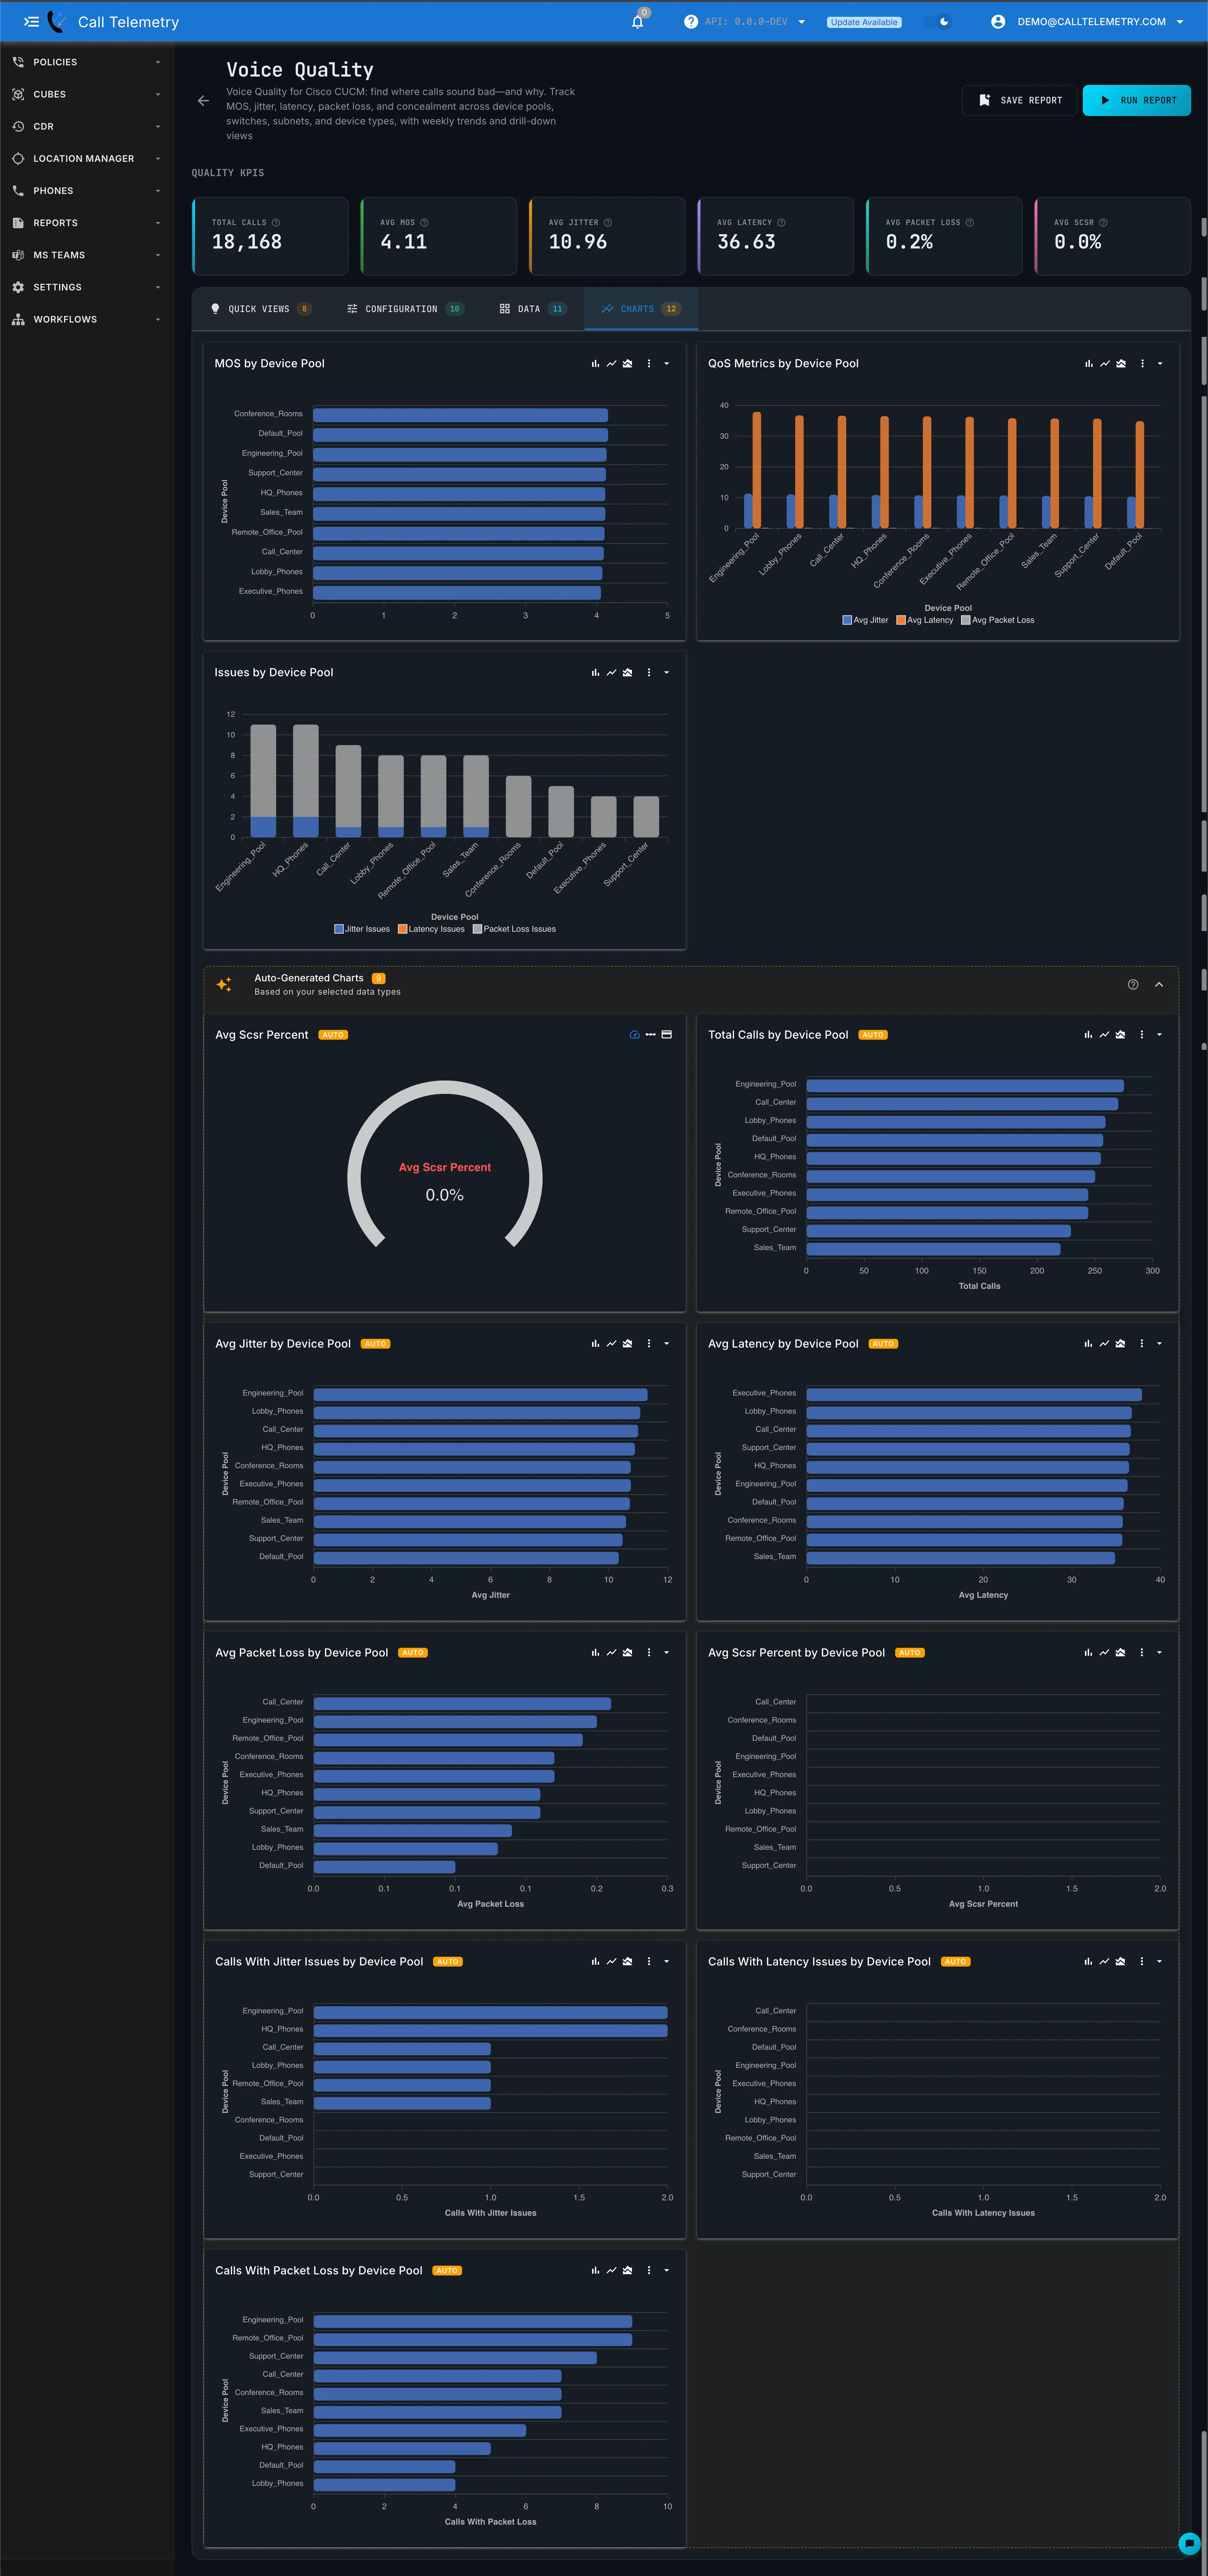
Chart types include bar charts, horizontal bars, gauges, and time series—automatically selected based on your dimensions and metrics.
Saving Reports
- Click Save in the header
- Enter a name and optional description
- Access later from Reports → Saved Reports
See Saved and Scheduled Reports for automation.
Next Steps
- UC Analytics Dashboard — Pin reports as live dashboard widgets with charts and real-time refresh
- CDR Reporting — Search and export raw call detail records
- Saved and Scheduled Reports
- Report Examples — Find the right report by question and inspect sample output