Call Flow Investigation (Cradle-to-Grave)
EssentialsCall Telemetry provides a unified toolset for Cisco CDR analysis. For aggregated trends, see Reporting Overview. For raw record search, use CDR Reporting. For voice quality metrics, see Call Quality Dashboard.
Cradle-to-Grave Trace links multiple call legs into a single view, showing the complete path from the initial dial to final disconnect.
To notify telecom staff after a zero-duration record arrives with an abnormal destination cause, configure the Failed Call Alert, then use this investigation view to trace the matching call.
When a call goes through hunt groups, transfers, or forwards, Cisco CallManager creates separate CDR records for each leg. This tool assembles them into a unified view so you can trace exactly what happened across the entire lifecycle of the call.
Requirements
- Call Telemetry Appliance version 0.8.6 or later
- CDR SFTP Integration configured
- Call Telemetry license (Community or higher)
Finding Calls
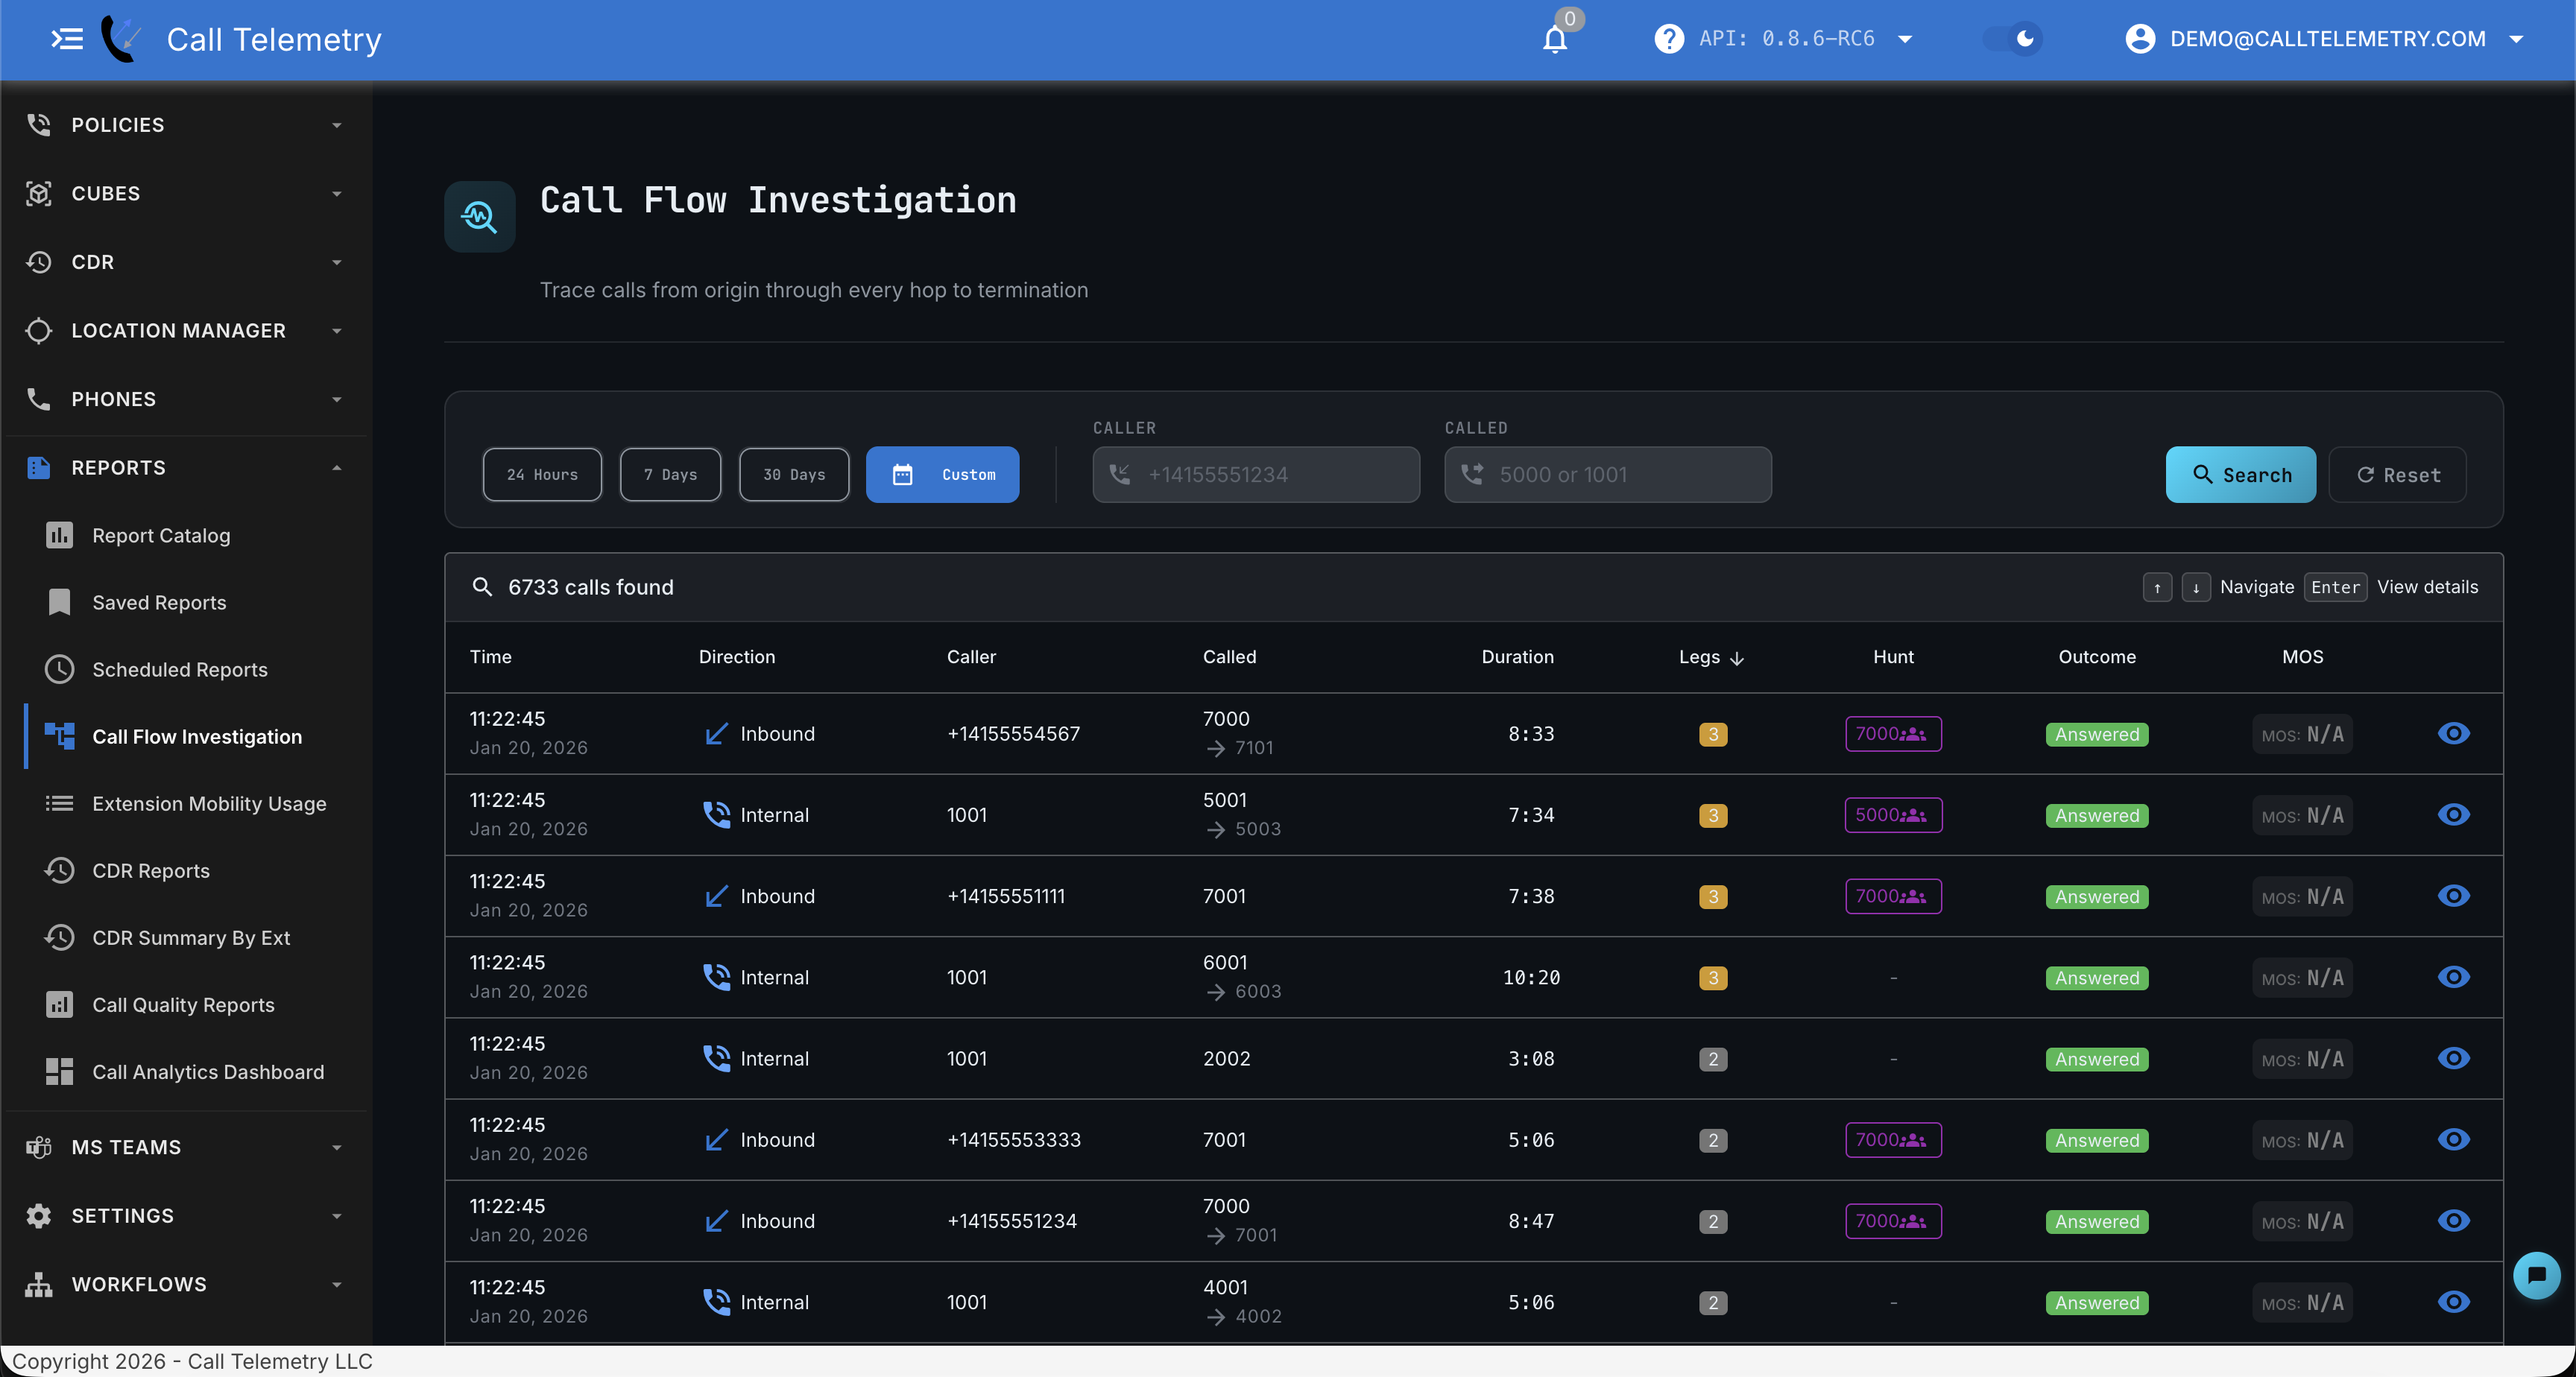
Navigate to Reports → Call Investigation to search and filter call records.
Search Options
- Time Range: Quick filters for All, 1 day, 7 days, 30 days, or Custom date range
- Direction Filters: Incoming, Outgoing, Internal, or All calls
- Hunt Filter: Show only calls that went through hunt groups
- Search: Filter by phone number (caller or called party)
- Export: Download results for external analysis
Results Table
| Column | Description |
|---|---|
| Time | When the call occurred |
| Direction | Inbound, Outbound, or Internal |
| Caller | Originating party (shows External for PSTN calls) |
| Called | Destination number or extension |
| Duration | Total call length |
| Legs | Number of call legs (hunt attempts, transfers) |
| Hunt | Indicates if call entered a hunt group |
| Outcome | Call status (Completed, No Answer, Busy, etc.) |
| MOS | Voice quality score when available — labeled Reported or Estimated; otherwise No quality data (see Reported vs. Estimated MOS below) |
Look for patterns that indicate complex calls:
| Indicator | What It Means |
|---|---|
| High leg count | Multiple hops—likely hunt attempts or transfers |
| Hunt icon | Call entered a hunt group or queue |
| Short duration, many legs | Possible missed calls or routing problems |
Call Detail View
Click any row to open the detailed call investigation view. The detail page shows the complete call journey with all participants and metrics.
Call Flow Visualization
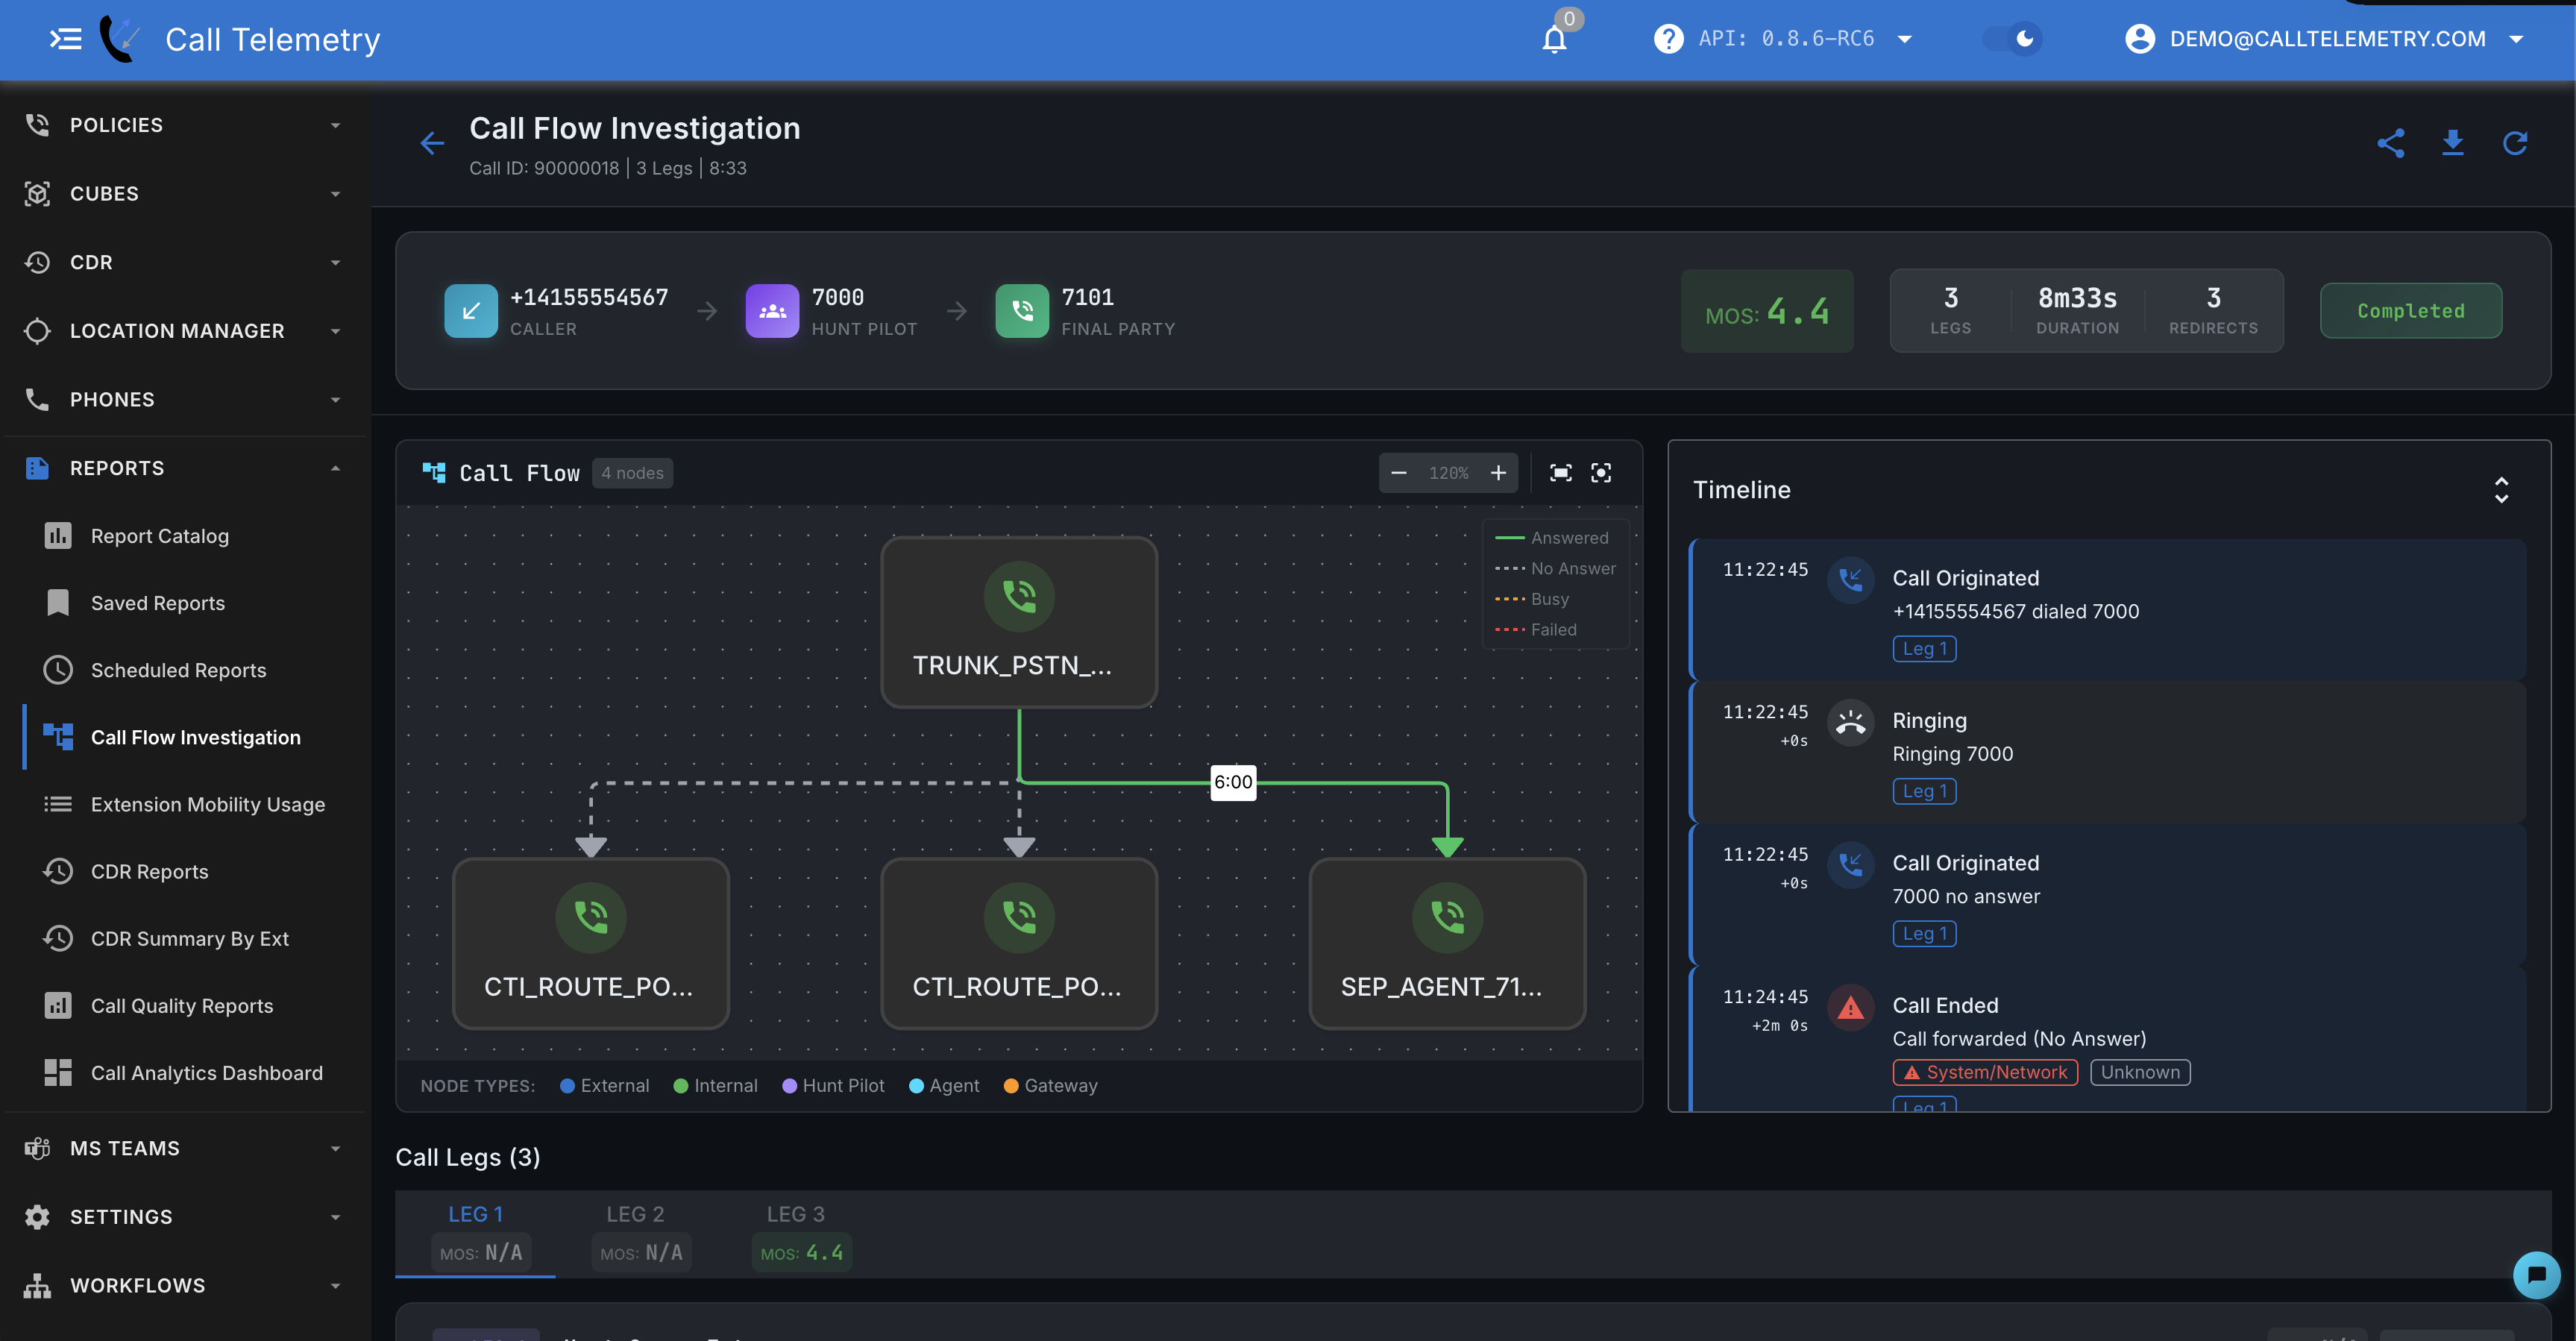
The top of the page displays a visual representation of the call path:
- Caller → Hunt Pilot → Final Party (for hunt group calls)
- Caller → Called Party (for direct calls)
- Each node shows the phone number or extension involved
Summary Metrics
| Metric | Description |
|---|---|
| MOS | Mean Opinion Score for voice quality (1-5 scale) |
| Legs | Total number of call segments |
| Duration | Total call length |
| Redirects | Number of times the call was forwarded |
| Status | Final outcome (Completed, No Answer, etc.) |
Call Information Tabs
Toggle between Formatted and Raw Fields views:
- Formatted: Organized display of call times, parties, and status
- Raw Fields: Complete CDR field data for technical analysis
- Copy JSON: Export raw data for integration or troubleshooting
Basic Call Information
The detail view displays:
- Call Times: Origination, Connected, and Disconnected timestamps
- Call Parties: Calling Party, Original Called Party, Final Called Party
- Call Status: Global Call ID, Call Type, Origin/Destination Cause codes
Icon Types
| Icon | Represents |
|---|---|
| External | Outside caller or destination (PSTN) |
| Internal | Extension in your phone system |
| Hunt Pilot | Hunt group or queue entry point |
| Agent | Hunt group member or queue agent |
| Gateway | CUBE, SIP trunk, or PSTN gateway |
Line Colors
| Color | Meaning |
|---|---|
| Solid green | Call connected and answered |
| Dashed gray | No answer—normal in hunt groups |
| Dashed amber | User was busy |
| Dashed red | Failure—network error or routing problem |
Gray lines in hunt groups are expected—they show agents who didn't answer before the call reached someone else. Red lines indicate problems.
Event Timeline
The timeline shows every event in order with time deltas:
- Call originated — Customer dialed
- Hunt group entered — Call reached the queue
- Redirected — Call forwarded (no answer, busy, or manual)
- Call connected — Someone answered
- Call ended — Shows who hung up and why
Click any event to see full details for that leg.
Voice Quality Per Leg
For answered calls, voice quality metrics from both endpoints:
| Metric | Good | Fair | Poor |
|---|---|---|---|
| MOS | Above 4.0 | 3.5 – 4.0 | Below 3.5 |
| Jitter | Under 30ms | 30 – 50ms | Over 50ms |
| Latency | Under 150ms | 150 – 300ms | Over 300ms |
| Packet Loss | Under 1% | 1 – 3% | Over 3% |
This shows which leg had quality problems—before the transfer, after, or throughout.
Reported vs. Estimated MOS
Every MOS score you see — on the call summary badge, in the Quality tab, in the Story view, and in the Call Flow diagram — is labeled by where it came from:
- Reported — the MOS value came directly from an endpoint's own quality report (CMR).
- Estimated — no endpoint reported a MOS, so Call Telemetry calculated one from jitter and packet loss instead.
- No quality data — neither a report nor enough signal to estimate from exists for that leg. Call Telemetry shows this plainly rather than defaulting to a healthy-looking score.
When a call has quality reports from both endpoints, both are shown rather than collapsed into a single number.
This labeling is consistent everywhere you investigate a call — the Story view, the Quality tab, the call summary badge, and the Call Flow diagram all agree on the same endpoint-specific MOS values and provenance labels for a given call.
Common Use Cases
Long Wait Time Investigation
Search for calls to your support queue. The timeline shows every redirect event with timestamps—how long the customer waited at each step.
Call Drop Troubleshooting
Find the call and check the final leg. The disconnect badge shows whether the customer, agent, or system ended the call. Voice quality metrics help identify if network issues caused the drop.
Routing Problems
Look for calls with high leg counts or repeated redirects. The flow graph reveals routing loops, misconfigured forwards, and IVR paths that don't work as expected.
Agent Performance
Filter by hunt pilot to see all calls to a queue. The flow graph shows which agents appeared in "no answer" legs versus who answered. For aggregate statistics, use the Hunt Group Summary report example.
Transfer Verification
Search for the caller's number. Look for legs marked "Transfer" in the redirect reason. You'll see whether the transfer completed and where it went.
Quality Issues
When audio quality degraded mid-call, per-leg metrics show exactly where—before the transfer, after, or when a specific gateway entered the path.
Compliance Documentation
Search by phone number and date range. Export the complete call path with timestamps, durations, and outcomes for audit documentation.
Related Features
- Reporting Overview — Aggregate reports for trends and summaries
- CDR Reporting — Search and export raw CDR data
- Voice Quality Reports — Organization-wide quality metrics
- Hunt Group Summary example — Agent performance and queue analytics